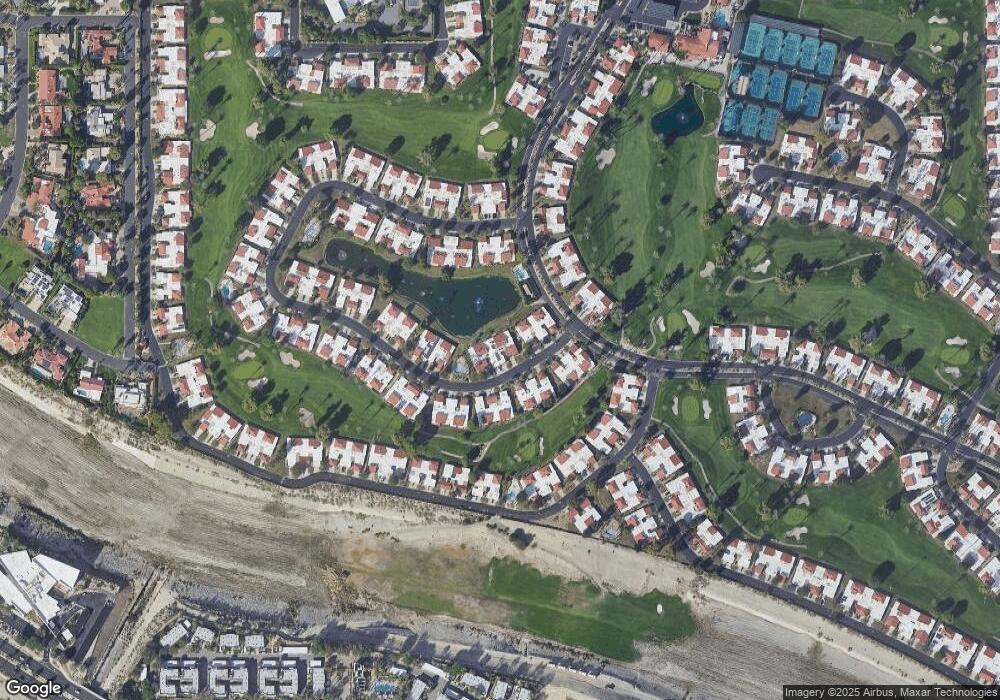
104 Palma Dr Rancho Mirage, CA 92270
Estimated Value: $498,000 - $654,000
3
Beds
2
Baths
1,800
Sq Ft
$331/Sq Ft
Est. Value
About This Home
This home is located at 104 Palma Dr, Rancho Mirage, CA 92270 and is currently estimated at $596,628, approximately $331 per square foot. 104 Palma Dr is a home located in Riverside County with nearby schools including Rancho Mirage Elementary School, Nellie N. Coffman Middle School, and Rancho Mirage High.
Ownership History
Date
Name
Owned For
Owner Type
Purchase Details
Closed on
Sep 25, 2008
Sold by
Blalock Mark F
Bought by
Park Center Exchange I Llc
Current Estimated Value
Home Financials for this Owner
Home Financials are based on the most recent Mortgage that was taken out on this home.
Original Mortgage
$200,000
Outstanding Balance
$132,005
Interest Rate
6.36%
Mortgage Type
Purchase Money Mortgage
Estimated Equity
$464,623
Purchase Details
Closed on
Sep 23, 2008
Sold by
Park Center Exchange 1 Llc
Bought by
Steil Robert Lewis
Home Financials for this Owner
Home Financials are based on the most recent Mortgage that was taken out on this home.
Original Mortgage
$200,000
Outstanding Balance
$132,005
Interest Rate
6.36%
Mortgage Type
Purchase Money Mortgage
Estimated Equity
$464,623
Create a Home Valuation Report for This Property
The Home Valuation Report is an in-depth analysis detailing your home's value as well as a comparison with similar homes in the area
Home Values in the Area
Average Home Value in this Area
Purchase History
| Date | Buyer | Sale Price | Title Company |
|---|---|---|---|
| Park Center Exchange I Llc | $385,000 | Orange Coast Title Co | |
| Steil Robert Lewis | -- | Orange Coast Title Co |
Source: Public Records
Mortgage History
| Date | Status | Borrower | Loan Amount |
|---|---|---|---|
| Open | Steil Robert Lewis | $200,000 |
Source: Public Records
Tax History Compared to Growth
Tax History
| Year | Tax Paid | Tax Assessment Tax Assessment Total Assessment is a certain percentage of the fair market value that is determined by local assessors to be the total taxable value of land and additions on the property. | Land | Improvement |
|---|---|---|---|---|
| 2025 | $6,631 | $495,766 | $160,959 | $334,807 |
| 2023 | $6,631 | $476,516 | $154,709 | $321,807 |
| 2022 | $6,546 | $467,174 | $151,676 | $315,498 |
| 2021 | $6,394 | $458,014 | $148,702 | $309,312 |
| 2020 | $6,074 | $453,319 | $147,178 | $306,141 |
| 2019 | $4,713 | $343,200 | $111,280 | $231,920 |
| 2018 | $4,549 | $330,000 | $107,000 | $223,000 |
| 2017 | $4,102 | $293,000 | $95,000 | $198,000 |
| 2016 | $3,900 | $280,000 | $91,000 | $189,000 |
| 2015 | $3,809 | $279,000 | $91,000 | $188,000 |
| 2014 | $4,007 | $292,000 | $95,000 | $197,000 |
Source: Public Records
Map
Nearby Homes