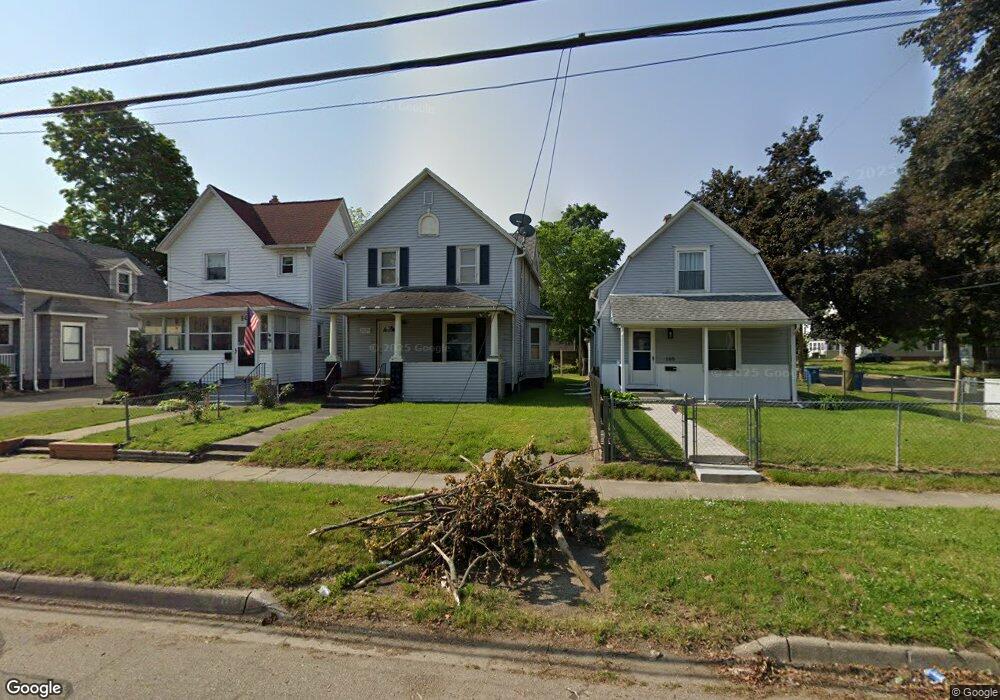
104 Post Ave Battle Creek, MI 49014
Post Franklin NeighborhoodEstimated Value: $84,000 - $126,000
3
Beds
2
Baths
1,708
Sq Ft
$56/Sq Ft
Est. Value
About This Home
This home is located at 104 Post Ave, Battle Creek, MI 49014 and is currently estimated at $96,074, approximately $56 per square foot. 104 Post Ave is a home located in Calhoun County with nearby schools including Post-Franklin Elementary School, Springfield Middle School, and Battle Creek Central High School.
Ownership History
Date
Name
Owned For
Owner Type
Purchase Details
Closed on
Sep 21, 2018
Sold by
Calhoun County Treasure
Bought by
Zimmer Edmund Sean and Zimmer Ashlee Anne
Current Estimated Value
Purchase Details
Closed on
May 11, 2011
Sold by
Ens Reo Group Llc
Bought by
Sg21 Pte Ltd
Purchase Details
Closed on
Oct 28, 2009
Sold by
Res Distressed Asset Fund Xvii Llc
Bought by
Ens Reo Group Llc
Purchase Details
Closed on
Aug 4, 2009
Sold by
The Bank Of New York Mellon
Bought by
Res Distressed Asset Fund Xvii Llc
Purchase Details
Closed on
Mar 17, 2009
Sold by
Poley Ricky L
Bought by
The Bank Of New York Mellon and The Bank Of New York
Purchase Details
Closed on
Feb 26, 2009
Sold by
Poley Ricky L
Bought by
The Bank Of New York Mellon and The Bank Of New York
Purchase Details
Closed on
Mar 27, 2003
Bought by
Poley Ricky J
Create a Home Valuation Report for This Property
The Home Valuation Report is an in-depth analysis detailing your home's value as well as a comparison with similar homes in the area
Home Values in the Area
Average Home Value in this Area
Purchase History
| Date | Buyer | Sale Price | Title Company |
|---|---|---|---|
| Zimmer Edmund Sean | $5,300 | None Available | |
| Sg21 Pte Ltd | $1,000 | None Available | |
| Ens Reo Group Llc | $4,500 | Madison Title Agency Llc | |
| Res Distressed Asset Fund Xvii Llc | $1,900 | None Available | |
| The Bank Of New York Mellon | -- | None Available | |
| The Bank Of New York Mellon | $14,500 | None Available | |
| Poley Ricky J | -- | -- |
Source: Public Records
Tax History Compared to Growth
Tax History
| Year | Tax Paid | Tax Assessment Tax Assessment Total Assessment is a certain percentage of the fair market value that is determined by local assessors to be the total taxable value of land and additions on the property. | Land | Improvement |
|---|---|---|---|---|
| 2025 | -- | $37,600 | $0 | $0 |
| 2024 | $1,006 | $31,461 | $0 | $0 |
| 2023 | $1,280 | $28,981 | $0 | $0 |
| 2022 | $909 | $22,471 | $0 | $0 |
| 2021 | $1,216 | $21,125 | $0 | $0 |
| 2020 | $1,111 | $18,481 | $0 | $0 |
| 2019 | $1,124 | $18,967 | $0 | $0 |
| 2018 | $1,124 | $17,181 | $330 | $16,851 |
| 2017 | $1,145 | $19,531 | $0 | $0 |
| 2016 | $1,142 | $22,151 | $0 | $0 |
| 2015 | $1,120 | $23,097 | $1,638 | $21,459 |
| 2014 | $1,120 | $17,424 | $1,638 | $15,786 |
Source: Public Records
Map
Nearby Homes
- 57 Euclid St
- 100 Illinois St
- 118 Nelson St
- 180 Grenville St
- 232 Cliff St
- 130 Cliff St
- 50 Douglas St
- 418 Main St
- 136 Jericho Rd
- 117 Inn Rd
- 501 Michigan Ave E
- 507 Michigan Ave E
- 390 E Michigan Ave
- 76 Taft St
- 47 Alden Ave W
- 802 Michigan Ave E
- 519 S Shore Dr
- 51 Pauline Ave
- 503 S Shore Dr
- 156 Woodway Ave