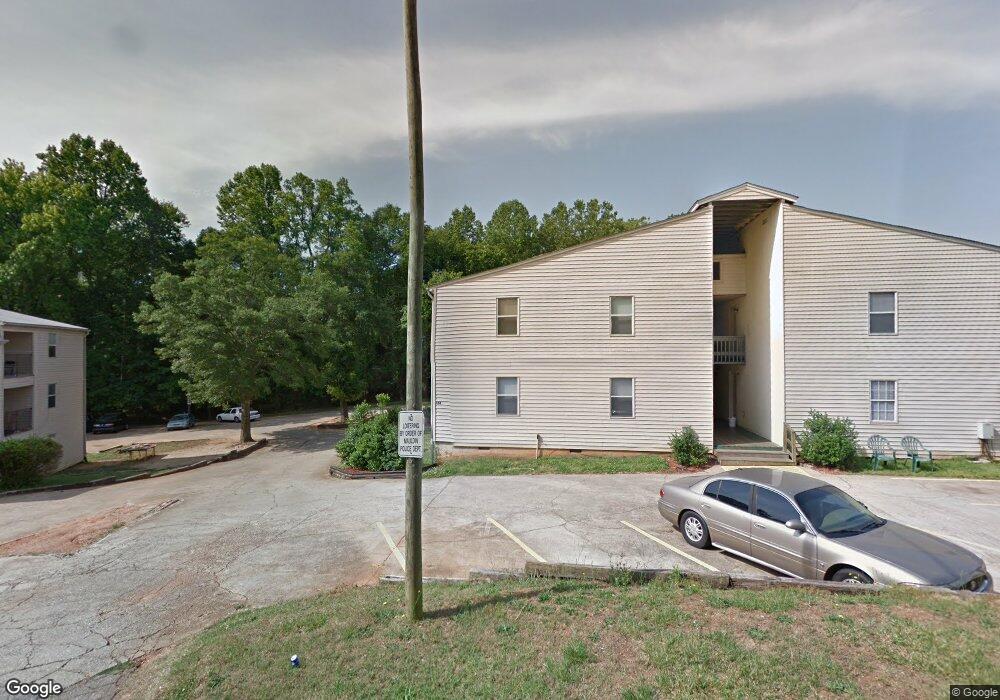
104 Rainbow Cir Unit 2 Mauldin, SC 29662
Estimated Value: $81,000 - $142,000
2
Beds
1
Bath
810
Sq Ft
$131/Sq Ft
Est. Value
About This Home
This home is located at 104 Rainbow Cir Unit 2, Mauldin, SC 29662 and is currently estimated at $106,276, approximately $131 per square foot. 104 Rainbow Cir Unit 2 is a home located in Greenville County with nearby schools including Bethel Elementary School, Mauldin Middle School, and Mauldin High School.
Ownership History
Date
Name
Owned For
Owner Type
Purchase Details
Closed on
Aug 29, 2014
Sold by
Wright James G and Fisher Kim
Bought by
St Pierre Marc
Current Estimated Value
Purchase Details
Closed on
Jan 24, 2013
Sold by
Federal Home Loan Mortgage Corporation
Bought by
Wright James G and Fisher Kim
Purchase Details
Closed on
Dec 4, 2012
Sold by
Toomey Patrick E
Bought by
Federal Home Loan Mortgage Corporation
Purchase Details
Closed on
Jul 24, 2007
Sold by
Tangkitkietikul Sherry Lockaby and Tangkitkietikul Decha
Bought by
Toomey Patrick E
Home Financials for this Owner
Home Financials are based on the most recent Mortgage that was taken out on this home.
Original Mortgage
$40,000
Interest Rate
6.52%
Mortgage Type
Purchase Money Mortgage
Purchase Details
Closed on
Nov 2, 1998
Sold by
Moore Euphemia S
Bought by
Tangkitkietikul Decha
Create a Home Valuation Report for This Property
The Home Valuation Report is an in-depth analysis detailing your home's value as well as a comparison with similar homes in the area
Home Values in the Area
Average Home Value in this Area
Purchase History
| Date | Buyer | Sale Price | Title Company |
|---|---|---|---|
| St Pierre Marc | $31,000 | -- | |
| Wright James G | $26,900 | -- | |
| Federal Home Loan Mortgage Corporation | $20,000 | -- | |
| Toomey Patrick E | $40,000 | None Available | |
| Tangkitkietikul Decha | $33,500 | -- |
Source: Public Records
Mortgage History
| Date | Status | Borrower | Loan Amount |
|---|---|---|---|
| Previous Owner | Toomey Patrick E | $40,000 |
Source: Public Records
Tax History
| Year | Tax Paid | Tax Assessment Tax Assessment Total Assessment is a certain percentage of the fair market value that is determined by local assessors to be the total taxable value of land and additions on the property. | Land | Improvement |
|---|---|---|---|---|
| 2025 | $822 | $2,630 | $300 | $2,330 |
| 2024 | $822 | $2,290 | $360 | $1,930 |
| 2023 | $795 | $2,290 | $360 | $1,930 |
| 2022 | $747 | $2,290 | $360 | $1,930 |
| 2021 | $737 | $2,290 | $360 | $1,930 |
| 2020 | $757 | $2,200 | $360 | $1,840 |
| 2019 | $757 | $2,200 | $360 | $1,840 |
| 2018 | $743 | $2,200 | $360 | $1,840 |
| 2017 | $732 | $2,200 | $360 | $1,840 |
| 2016 | $702 | $36,620 | $6,000 | $30,620 |
| 2015 | $702 | $36,620 | $6,000 | $30,620 |
| 2014 | $303 | $41,170 | $6,000 | $35,170 |
Source: Public Records
Map
Nearby Homes
- 48 Ridgestone Cir
- 111 Oak Park Dr
- 120 Shadecrest Dr
- 419 Cedar Bluff Way
- 201 Fern Hollow Way
- 9 Endeavor Cir
- 33 Endeavor Cir
- 145 Oak Park Dr
- 68 Endeavor Cir
- 113 Heather Ln
- 105 Mauldin Cir
- 202 N Main St
- 525 Martinshire Way
- 227 E Butler Rd
- 242 Santorini Way
- 254 Santorini Way
- 110 Cambria Ct
- 100 Swinton Dr
- 20 Golden Apple Trail
- 2016 Spring Wood Dr Unit 2016
- 104 Rainbow Cir Unit 4
- 104 Rainbow Cir Unit 1
- 104 Rainbow Cir Unit 2
- 104 Rainbow Cir Unit 2
- 104 Rainbow Cir Unit 2
- 104 Rainbow Cir Unit 18
- 104 Rainbow Cir Unit 1
- 104 Rainbow Cir Unit 1
- 104 Rainbow Cir Unit 1
- 104 Rainbow Cir Unit 1
- 104 Rainbow Cir Unit 2
- 104 Rainbow Cir Unit 2
- 104 Rainbow Cir Unit 2
- 104 Rainbow Cir Unit 2
- 104 Rainbow Cir
- 104 Rainbow Cir Unit 1
- 104 Rainbow Cir Unit 1
- 104 Rainbow Cir Unit 1
- 104 Rainbow Cir Unit 4
- 104 Rainbow Cir Unit 7
Your Personal Tour Guide
Ask me questions while you tour the home.