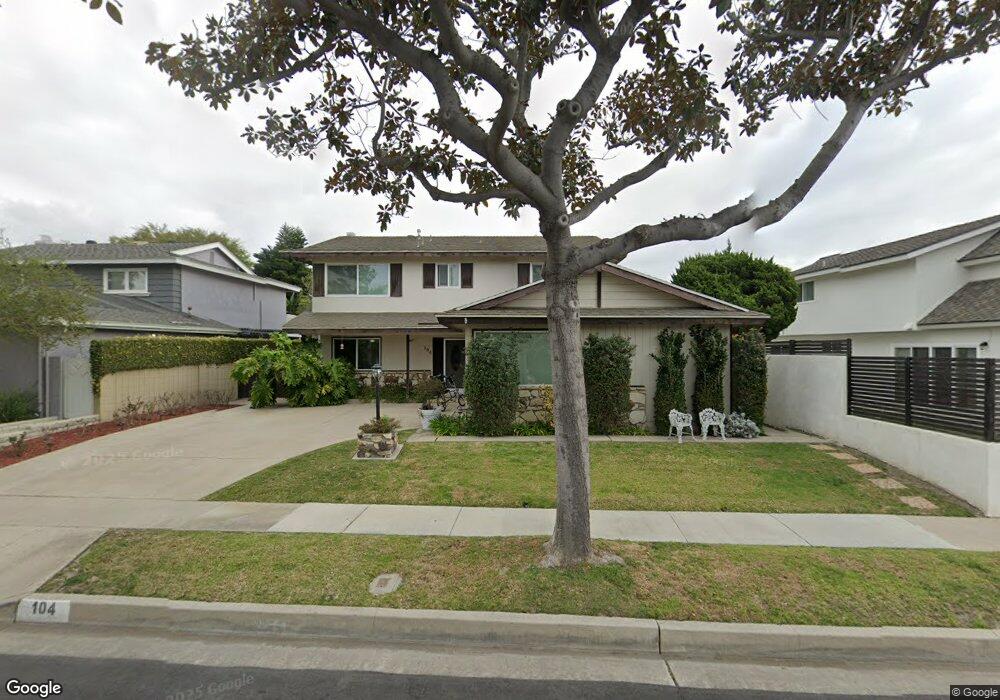
104 Stanford Ln Seal Beach, CA 90740
Estimated Value: $1,281,741 - $1,617,000
5
Beds
3
Baths
2,072
Sq Ft
$716/Sq Ft
Est. Value
About This Home
This home is located at 104 Stanford Ln, Seal Beach, CA 90740 and is currently estimated at $1,484,185, approximately $716 per square foot. 104 Stanford Ln is a home located in Orange County with nearby schools including Francis Hopkinson Elementary School, Jack L. Weaver Elementary School, and Oak Middle School.
Ownership History
Date
Name
Owned For
Owner Type
Purchase Details
Closed on
Sep 15, 2022
Sold by
Christensen And Sasina Trust
Bought by
Randall M Christensen Trust
Current Estimated Value
Purchase Details
Closed on
Feb 16, 2022
Sold by
Christensen Randall M
Bought by
Christensen And Sasina Trust
Home Financials for this Owner
Home Financials are based on the most recent Mortgage that was taken out on this home.
Original Mortgage
$427,000
Interest Rate
3.69%
Mortgage Type
New Conventional
Purchase Details
Closed on
Apr 1, 2010
Sold by
Christensen Randall M
Bought by
Christensen Randall M and Sasina Pamela Ann
Purchase Details
Closed on
Dec 23, 2009
Sold by
Christensen Randall M
Bought by
Christensen Randall M
Purchase Details
Closed on
Dec 11, 2002
Sold by
Christensen Earl J
Bought by
Christensen Earl J and Christensen Randall M
Create a Home Valuation Report for This Property
The Home Valuation Report is an in-depth analysis detailing your home's value as well as a comparison with similar homes in the area
Home Values in the Area
Average Home Value in this Area
Purchase History
| Date | Buyer | Sale Price | Title Company |
|---|---|---|---|
| Randall M Christensen Trust | -- | -- | |
| Christensen And Sasina Trust | -- | Accommodation/Courtesy Recordi | |
| Christensen Randall M | -- | Chicago Title | |
| Christensen Randall M | -- | None Available | |
| Christensen Randall M | -- | North American Title Company | |
| Christensen Randall M | -- | North American Title Company | |
| Christensen Earl J | -- | -- |
Source: Public Records
Mortgage History
| Date | Status | Borrower | Loan Amount |
|---|---|---|---|
| Previous Owner | Christensen Randall M | $427,000 |
Source: Public Records
Tax History Compared to Growth
Tax History
| Year | Tax Paid | Tax Assessment Tax Assessment Total Assessment is a certain percentage of the fair market value that is determined by local assessors to be the total taxable value of land and additions on the property. | Land | Improvement |
|---|---|---|---|---|
| 2025 | $1,771 | $106,322 | $32,156 | $74,166 |
| 2024 | $1,771 | $104,238 | $31,526 | $72,712 |
| 2023 | $1,721 | $102,195 | $30,908 | $71,287 |
| 2022 | $1,696 | $100,192 | $30,302 | $69,890 |
| 2021 | $1,734 | $98,228 | $29,708 | $68,520 |
| 2020 | $1,726 | $97,221 | $29,403 | $67,818 |
| 2019 | $1,675 | $95,315 | $28,826 | $66,489 |
| 2018 | $1,585 | $93,447 | $28,261 | $65,186 |
| 2017 | $1,474 | $91,615 | $27,707 | $63,908 |
| 2016 | $1,443 | $89,819 | $27,164 | $62,655 |
| 2015 | $1,419 | $88,470 | $26,756 | $61,714 |
| 2014 | $1,372 | $86,737 | $26,231 | $60,506 |
Source: Public Records
Map
Nearby Homes
- 13061 Oak Hills Dr Unit 221D
- 13021 Oak Hills Dr Unit 219H
- 1075 Brookline Rd
- 13081 Oak Hills Dr
- 1100 Brookline Rd
- 13410 Oak Hills Dr Unit 224D
- 1121 Northwood Rd Unit 237A M9
- 13201 El Dorado Dr Unit 207-I
- 1150 Northwood Rd Unit 166E M7
- 12725 Martha Ann Dr
- 13261 Southport Ln
- 13301 El Dorado Dr
- 13171 St Andrews Dr Unit 154-J
- 6911 E 10th St
- 2692 Copa de Oro Dr
- 13110 Seaview Ln Unit 245B
- 13380 El Dorado Dr
- 865 Kallin Ave
- 1301 Oakmont Rd Unit 145C
- 13381 Fairfield Ln
- 108 Stanford Ln
- 145 College Park Dr
- 141 College Park Dr
- 149 College Park Dr
- 112 Stanford Ln
- 109 Yale Ln
- 105 Yale Ln
- 129 College Park Dr
- 105 Stanford Ln
- 101 Yale Ln
- 109 Stanford Ln
- 116 Stanford Ln
- 113 Yale Ln
- 113 Stanford Ln
- 125 College Park Dr
- 401 Purdue Cir
- 124 Stanford Ln
- 144 College Park Dr
- 148 College Park Dr
- 140 College Park Dr