Estimated Value: $236,000 - $306,000
3
Beds
2
Baths
1,252
Sq Ft
$219/Sq Ft
Est. Value
About This Home
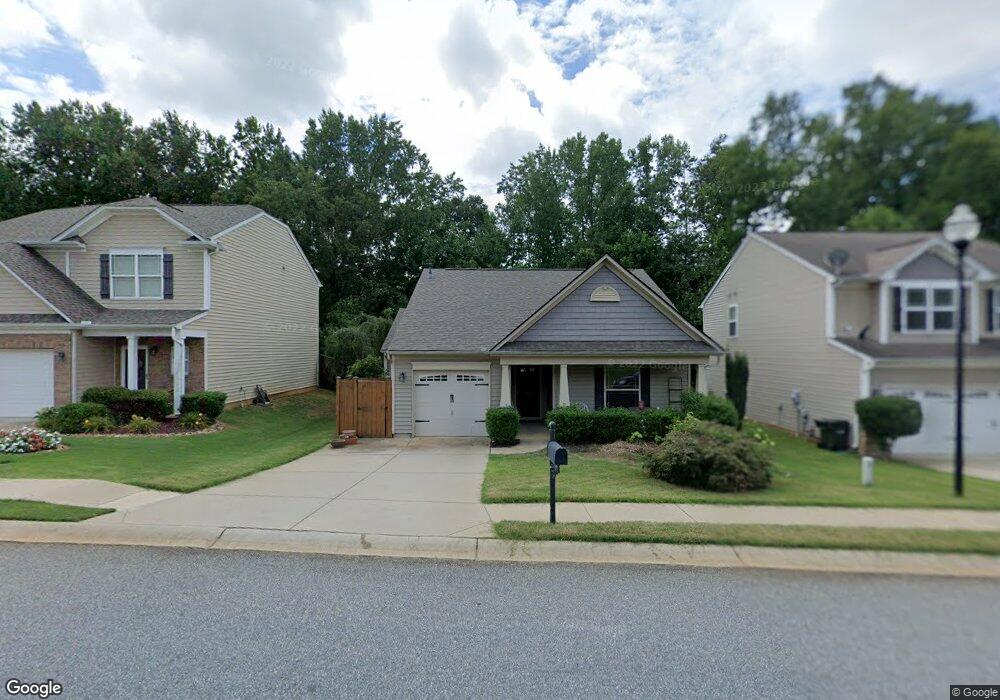
This home is located at 104 Stream Crossing Way, Greer, SC 29650 and is currently estimated at $273,733, approximately $218 per square foot. 104 Stream Crossing Way is a home located in Greenville County with nearby schools including Woodland Elementary School, Riverside Middle School, and Riverside High School.
Ownership History
Date
Name
Owned For
Owner Type
Purchase Details
Closed on
Apr 30, 2018
Sold by
Smale Michael A and Ertl Smale Rosemarie
Bought by
Mott Linda Lee
Current Estimated Value
Home Financials for this Owner
Home Financials are based on the most recent Mortgage that was taken out on this home.
Original Mortgage
$104,985
Outstanding Balance
$89,504
Interest Rate
4.44%
Mortgage Type
New Conventional
Estimated Equity
$184,229
Purchase Details
Closed on
Jun 29, 2011
Sold by
Eastwood Construction Llc
Bought by
Smale Michael A and Ertl Smale Rosemarie
Home Financials for this Owner
Home Financials are based on the most recent Mortgage that was taken out on this home.
Original Mortgage
$91,488
Interest Rate
4.62%
Mortgage Type
New Conventional
Purchase Details
Closed on
Mar 15, 2011
Sold by
Hggs Llc
Bought by
Eastwood Construction Llc
Purchase Details
Closed on
Dec 22, 2009
Sold by
Hammett Grove Llc
Bought by
Crm Mid Atlantic Properties Llc
Create a Home Valuation Report for This Property
The Home Valuation Report is an in-depth analysis detailing your home's value as well as a comparison with similar homes in the area
Home Values in the Area
Average Home Value in this Area
Purchase History
| Date | Buyer | Sale Price | Title Company |
|---|---|---|---|
| Mott Linda Lee | $150,000 | None Available | |
| Smale Michael A | $129,038 | -- | |
| Eastwood Construction Llc | $20,500 | -- | |
| Crm Mid Atlantic Properties Llc | $1,000 | -- |
Source: Public Records
Mortgage History
| Date | Status | Borrower | Loan Amount |
|---|---|---|---|
| Open | Mott Linda Lee | $104,985 | |
| Previous Owner | Smale Michael A | $91,488 |
Source: Public Records
Tax History
| Year | Tax Paid | Tax Assessment Tax Assessment Total Assessment is a certain percentage of the fair market value that is determined by local assessors to be the total taxable value of land and additions on the property. | Land | Improvement |
|---|---|---|---|---|
| 2025 | $1,704 | $6,860 | $1,910 | $4,950 |
| 2024 | $1,704 | $5,970 | $1,160 | $4,810 |
| 2023 | $1,581 | $5,970 | $1,160 | $4,810 |
| 2022 | $1,470 | $5,970 | $1,160 | $4,810 |
| 2021 | $1,440 | $5,970 | $1,160 | $4,810 |
| 2020 | $1,359 | $5,450 | $960 | $4,490 |
| 2019 | $1,353 | $5,450 | $960 | $4,490 |
| 2018 | $3,123 | $8,180 | $1,440 | $6,740 |
| 2017 | $3,072 | $8,180 | $1,440 | $6,740 |
| 2016 | $2,780 | $125,870 | $24,000 | $101,870 |
| 2015 | $2,740 | $125,870 | $24,000 | $101,870 |
| 2014 | $2,806 | $130,370 | $26,500 | $103,870 |
Source: Public Records
Map
Nearby Homes
- 104 Oak Forest Dr
- 109 Quail Creek Dr
- 131 A Dillard Dr
- 519 Longview Terrace
- 109 Buddy Ave
- 133 Fawnbrook Dr
- 402 Teresa Gem Ln
- 7 Country Dale Dr
- 32 Country Dale Dr
- 68 Riley Eden Ln Unit Site 3
- 76 Riley Eden Ln Unit Site 1
- 107 Kingscreek Dr
- 528 Lifescape Ln
- 912 S Main St
- 209 Quickstep Dr
- 418 Palazzo Place
- 410 Palazzo Place
- 420 Yellow Fox Rd
- 145 Spring Crossing Cir
- 535 Yellow Fox Rd
- 108 Stream Crossing Way
- 100 Stream Crossing Way
- 112 Stream Crossing Way
- 30 Stream Crossing Way
- 26 Stream Crossing Way
- 116 Stream Crossing Way
- 43 Stream Crossing Way
- 22 Stream Crossing Way
- 120 Stream Crossing Way
- 14 Knoll Ridge Dr
- 12 Knoll Ridge Dr
- 16 Knoll Ridge Dr
- 10 Knoll Ridge Dr
- 115 Stream Crossing Way
- 100 Knoll Ridge Dr
- 105 Stream Crossing Way
- 39 Stream Crossing Way
- 18 Stream Crossing Way
- 8 Knoll Ridge Dr
- 109 Stream Crossing Way
Your Personal Tour Guide
Ask me questions while you tour the home.