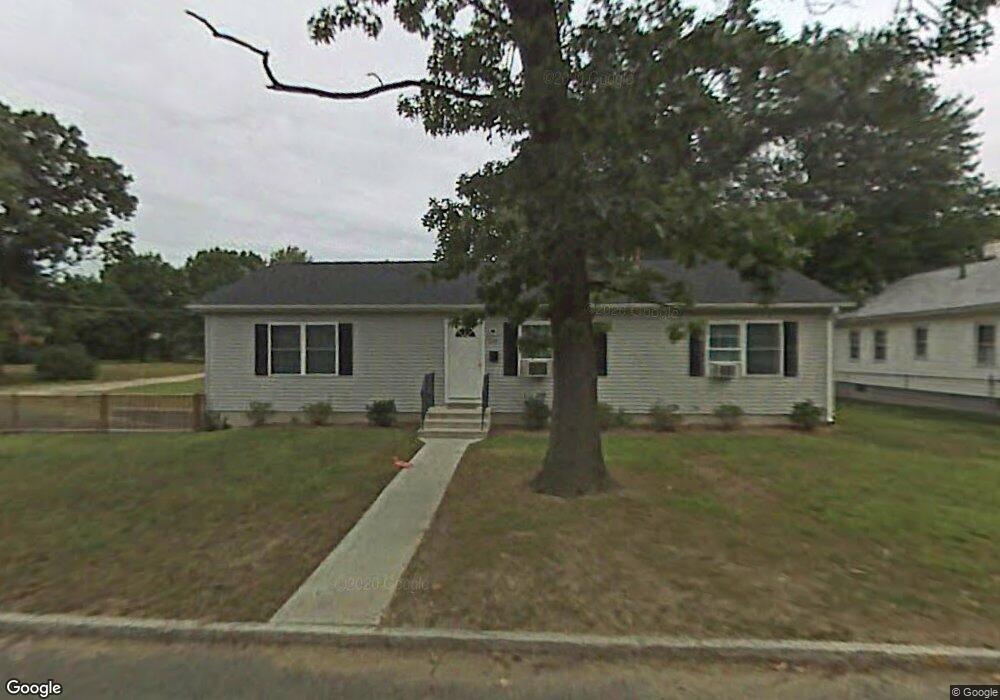
104 Switzer Ave Springfield, MA 01109
Pine Point NeighborhoodEstimated Value: $319,000 - $366,000
3
Beds
2
Baths
1,485
Sq Ft
$232/Sq Ft
Est. Value
About This Home
This home is located at 104 Switzer Ave, Springfield, MA 01109 and is currently estimated at $344,114, approximately $231 per square foot. 104 Switzer Ave is a home located in Hampden County with nearby schools including Hiram L. Dorman Elementary, John F. Kennedy Academy, and Springfield Central High School.
Ownership History
Date
Name
Owned For
Owner Type
Purchase Details
Closed on
Nov 23, 2005
Sold by
Bmt Dev Corp
Bought by
Harris Catherine M
Current Estimated Value
Home Financials for this Owner
Home Financials are based on the most recent Mortgage that was taken out on this home.
Original Mortgage
$161,520
Outstanding Balance
$88,608
Interest Rate
6.06%
Mortgage Type
Purchase Money Mortgage
Estimated Equity
$255,506
Create a Home Valuation Report for This Property
The Home Valuation Report is an in-depth analysis detailing your home's value as well as a comparison with similar homes in the area
Home Values in the Area
Average Home Value in this Area
Purchase History
| Date | Buyer | Sale Price | Title Company |
|---|---|---|---|
| Harris Catherine M | $201,900 | -- |
Source: Public Records
Mortgage History
| Date | Status | Borrower | Loan Amount |
|---|---|---|---|
| Open | Harris Catherine M | $161,520 | |
| Closed | Harris Catherine M | $40,380 |
Source: Public Records
Tax History Compared to Growth
Tax History
| Year | Tax Paid | Tax Assessment Tax Assessment Total Assessment is a certain percentage of the fair market value that is determined by local assessors to be the total taxable value of land and additions on the property. | Land | Improvement |
|---|---|---|---|---|
| 2025 | $4,579 | $292,000 | $39,000 | $253,000 |
| 2024 | $4,667 | $290,600 | $39,000 | $251,600 |
| 2023 | $4,157 | $243,800 | $34,500 | $209,300 |
| 2022 | $3,728 | $198,100 | $32,300 | $165,800 |
| 2021 | $3,606 | $190,800 | $29,300 | $161,500 |
| 2020 | $3,572 | $182,900 | $29,300 | $153,600 |
| 2019 | $3,647 | $185,300 | $30,400 | $154,900 |
| 2018 | $3,596 | $182,700 | $30,400 | $152,300 |
| 2017 | $3,378 | $171,800 | $33,400 | $138,400 |
| 2016 | $3,045 | $154,900 | $33,400 | $121,500 |
| 2015 | $3,008 | $152,900 | $33,400 | $119,500 |
Source: Public Records
Map
Nearby Homes