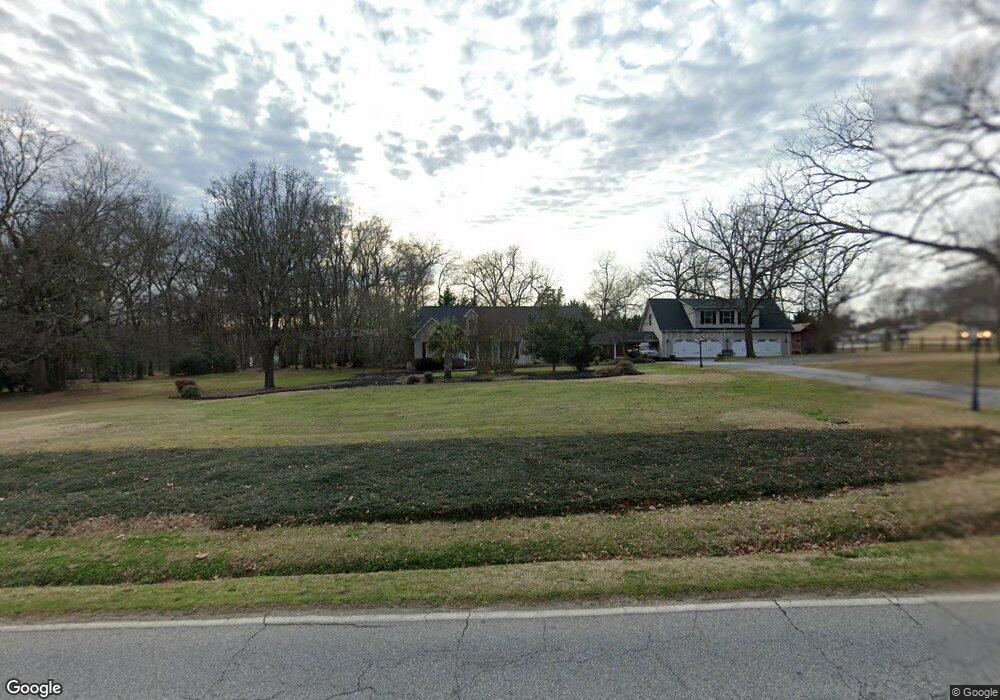
104 Taylors Rd Taylors, SC 29687
Estimated Value: $485,000 - $607,981
6
Beds
6
Baths
2,630
Sq Ft
$204/Sq Ft
Est. Value
About This Home
This home is located at 104 Taylors Rd, Taylors, SC 29687 and is currently estimated at $536,745, approximately $204 per square foot. 104 Taylors Rd is a home located in Greenville County with nearby schools including Brook Glenn Elementary School, Northwood Middle School, and Riverside High School.
Ownership History
Date
Name
Owned For
Owner Type
Purchase Details
Closed on
Aug 10, 2022
Sold by
Stone Joseph T
Bought by
Falk Eric C and Falk Natilee
Current Estimated Value
Purchase Details
Closed on
Dec 10, 2015
Sold by
Buxbaum Roberta E
Bought by
Falk Eric C and Falk Natilee
Home Financials for this Owner
Home Financials are based on the most recent Mortgage that was taken out on this home.
Original Mortgage
$200,000
Interest Rate
4.01%
Mortgage Type
New Conventional
Purchase Details
Closed on
Dec 24, 2014
Sold by
Estate Of Michael Lee Buxbaum
Bought by
Buxbaum Roberta E
Purchase Details
Closed on
Nov 15, 2012
Sold by
Stone Joseph T and Stone Pamela K
Bought by
Buxbaum Michael L and Buxbaum Roberta E
Home Financials for this Owner
Home Financials are based on the most recent Mortgage that was taken out on this home.
Original Mortgage
$229,837
Interest Rate
3.4%
Mortgage Type
VA
Create a Home Valuation Report for This Property
The Home Valuation Report is an in-depth analysis detailing your home's value as well as a comparison with similar homes in the area
Home Values in the Area
Average Home Value in this Area
Purchase History
| Date | Buyer | Sale Price | Title Company |
|---|---|---|---|
| Falk Eric C | -- | Mckinney Wm Dale | |
| Falk Eric C | -- | Mckinney Wm Dale | |
| Falk Eric C | $250,000 | None Available | |
| Buxbaum Roberta E | -- | -- | |
| Buxbaum Michael L | $225,000 | -- |
Source: Public Records
Mortgage History
| Date | Status | Borrower | Loan Amount |
|---|---|---|---|
| Previous Owner | Falk Eric C | $200,000 | |
| Previous Owner | Buxbaum Michael L | $229,837 |
Source: Public Records
Tax History Compared to Growth
Tax History
| Year | Tax Paid | Tax Assessment Tax Assessment Total Assessment is a certain percentage of the fair market value that is determined by local assessors to be the total taxable value of land and additions on the property. | Land | Improvement |
|---|---|---|---|---|
| 2024 | $2,550 | $12,160 | $1,850 | $10,310 |
| 2023 | $2,509 | $18,250 | $2,780 | $15,470 |
| 2022 | $6,125 | $18,110 | $2,640 | $15,470 |
| 2021 | $6,347 | $12,070 | $1,760 | $10,310 |
| 2020 | $2,665 | $11,990 | $1,760 | $10,230 |
| 2019 | $2,635 | $11,990 | $1,760 | $10,230 |
| 2018 | $2,592 | $11,990 | $1,760 | $10,230 |
| 2017 | $2,559 | $11,990 | $1,760 | $10,230 |
| 2016 | $2,159 | $260,520 | $44,080 | $216,440 |
| 2015 | $5,206 | $260,520 | $44,080 | $216,440 |
| 2014 | -- | $310,930 | $44,080 | $266,850 |
Source: Public Records
Map
Nearby Homes
- 117 Selton Place Unit FP 24 Teton B
- 113 Selton Place Unit FP 22 Teton A1E
- 120 Selton Place Unit FP 31 Teton B
- Teton Plan at Freeman Park
- 1 Longmeadow Rd
- 207 Winding Willow Trail
- 2 Hillbrook Rd
- 107 Selton Place Unit FP 19 Teton B
- 122 Selton Place Unit FP 30 Teton B
- 121 Selton Place Unit FP 26 Teton A1E
- 125 Selton Place
- 123 Selton Place Unit FP 27 Teton B
- 125 Selton Place Unit FP 28 Teton A1E
- 101 E Main St
- 122 Stephenson Street Extension
- 200 Hillbrook Rd
- 5 Nova St
- 2407 E Lee Rd
- 221 Wood River Way
- 316 Cambrian Ct Unit Homesite 36