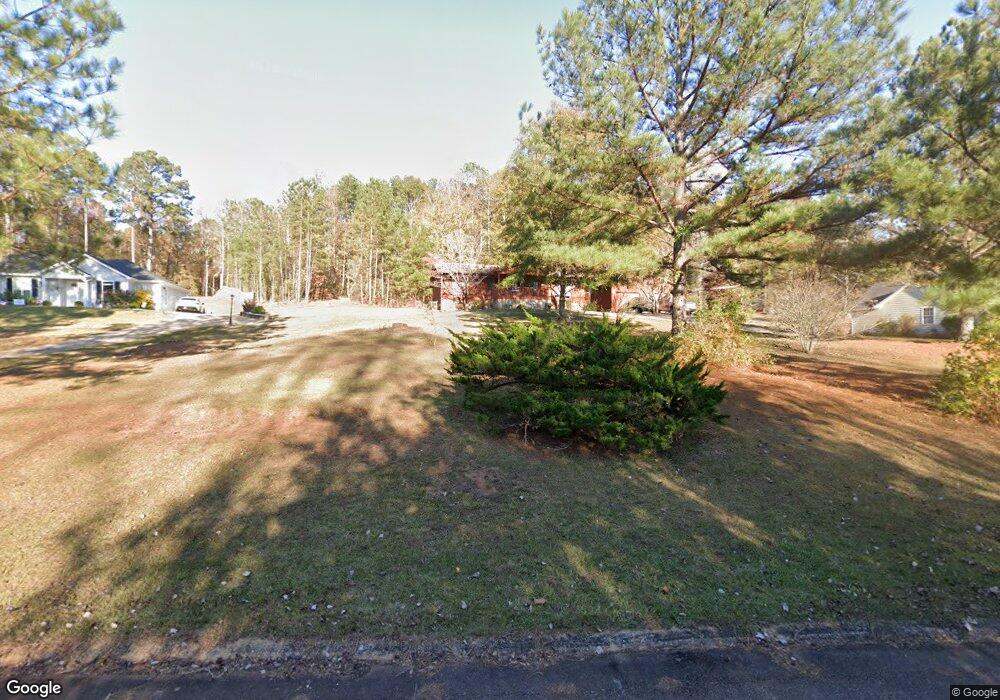
104 Tyler St Lagrange, GA 30240
Estimated Value: $248,719 - $319,000
3
Beds
2
Baths
1,765
Sq Ft
$153/Sq Ft
Est. Value
About This Home
This home is located at 104 Tyler St, Lagrange, GA 30240 and is currently estimated at $270,680, approximately $153 per square foot. 104 Tyler St is a home located in Troup County with nearby schools including Long Cane Elementary School, West Point Elementary School, and Berta Weathersbee Elementary School.
Ownership History
Date
Name
Owned For
Owner Type
Purchase Details
Closed on
Sep 10, 2025
Sold by
Street Steven D
Bought by
Street Reba V and Street Steven D
Current Estimated Value
Purchase Details
Closed on
Apr 24, 2002
Sold by
Chris Scardino and Jenn Dotting
Bought by
Street Steven D
Purchase Details
Closed on
Apr 23, 2002
Sold by
Chris Scardino and Jenn Dotting
Bought by
Chris Scardino and Jenn Dotting
Purchase Details
Closed on
Nov 13, 2000
Sold by
Merchant Sharon L
Bought by
Chris Scardino and Jenn Dotting
Purchase Details
Closed on
Sep 1, 1995
Sold by
Henry L Merchant
Bought by
Merchant Sharon L
Purchase Details
Closed on
Nov 17, 1994
Sold by
Reeves Pamela P
Bought by
Henry L Merchant
Purchase Details
Closed on
Dec 11, 1990
Bought by
Reeves Pamela P
Purchase Details
Closed on
Jan 17, 1990
Purchase Details
Closed on
Dec 15, 1989
Purchase Details
Closed on
Dec 13, 1989
Purchase Details
Closed on
Aug 7, 1989
Purchase Details
Closed on
Apr 21, 1987
Sold by
Cole Jessie H
Purchase Details
Closed on
Apr 4, 1984
Sold by
Tyler Dan G
Bought by
Cole Jessie H
Create a Home Valuation Report for This Property
The Home Valuation Report is an in-depth analysis detailing your home's value as well as a comparison with similar homes in the area
Purchase History
| Date | Buyer | Sale Price | Title Company |
|---|---|---|---|
| Street Reba V | -- | -- | |
| Street Steven D | $51,000 | -- | |
| Chris Scardino | $51,000 | -- | |
| Chris Scardino | -- | -- | |
| Merchant Sharon L | -- | -- | |
| Henry L Merchant | $95,000 | -- | |
| Reeves Pamela P | $86,700 | -- | |
| -- | $84,000 | -- | |
| -- | -- | -- | |
| -- | -- | -- | |
| -- | -- | -- | |
| -- | $1,000 | -- | |
| Cole Jessie H | $40,000 | -- |
Source: Public Records
Tax History
| Year | Tax Paid | Tax Assessment Tax Assessment Total Assessment is a certain percentage of the fair market value that is determined by local assessors to be the total taxable value of land and additions on the property. | Land | Improvement |
|---|---|---|---|---|
| 2025 | $1,514 | $80,240 | $10,000 | $70,240 |
| 2024 | $1,514 | $63,320 | $10,000 | $53,320 |
| 2023 | $1,486 | $62,320 | $8,000 | $54,320 |
| 2022 | $1,409 | $58,200 | $8,000 | $50,200 |
| 2021 | $1,459 | $50,360 | $8,000 | $42,360 |
| 2020 | $1,284 | $44,560 | $4,000 | $40,560 |
| 2019 | $1,284 | $44,560 | $4,000 | $40,560 |
| 2018 | $1,172 | $40,840 | $4,000 | $36,840 |
| 2017 | $1,172 | $40,840 | $4,000 | $36,840 |
| 2016 | $1,163 | $40,534 | $4,000 | $36,534 |
| 2015 | $1,089 | $38,031 | $4,000 | $34,031 |
| 2014 | $1,037 | $36,240 | $4,000 | $32,240 |
| 2013 | -- | $37,778 | $4,000 | $33,778 |
Source: Public Records
Map
Nearby Homes
- 90 Hickory Ln
- 5714 W Point Rd
- 0 Lambert Rd
- Sandtown Road Unit: 1 2+ - Acre
- 0 Sandtown Rd Unit 10255987
- 107 Sweetwater Ct
- 102 Bridgewater Dr
- 107 Waters Edge Dr
- 394 Ferrell Tatum Rd
- 1248 Cannonville Rd
- 0 Warner Rd Unit 10686116
- 648 Warner Rd
- 206 Ann Murphy Rd
- 101 Garden Walk
- 4172 Bartley Rd
- 104 Hidden Springs Dr
- 1111 County Road 212
- 1095 County Road 212
- 0 Cannonville Rd
- 0 Ga Highway 0116 Unit 10619139
Your Personal Tour Guide
Ask me questions while you tour the home.