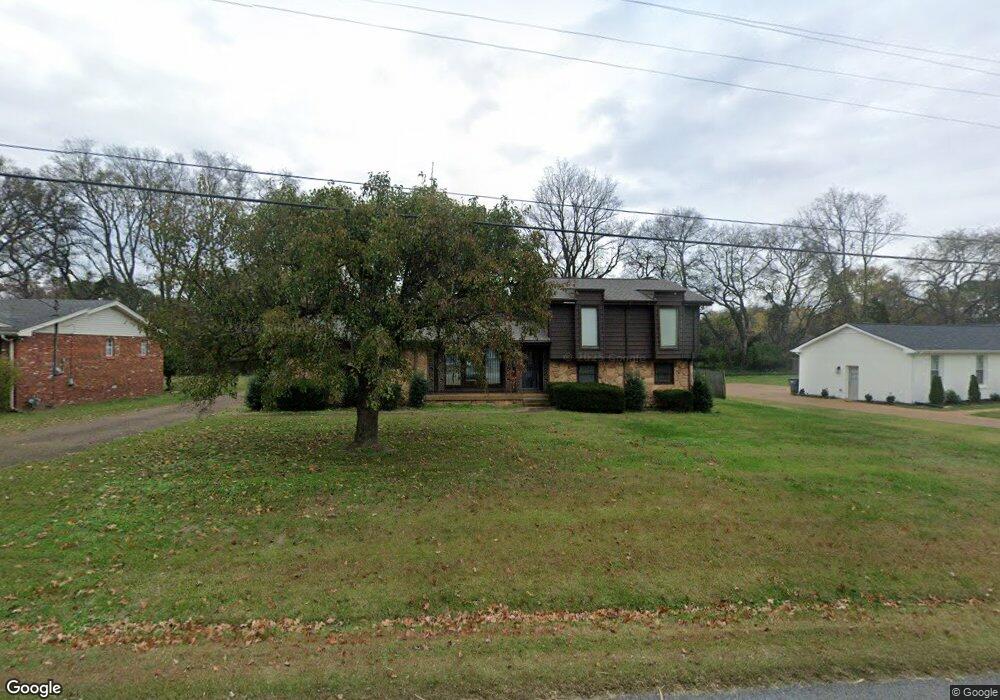
104 Tyne Blvd Old Hickory, TN 37138
Estimated Value: $352,232 - $422,000
--
Bed
2
Baths
1,714
Sq Ft
$228/Sq Ft
Est. Value
About This Home
This home is located at 104 Tyne Blvd, Old Hickory, TN 37138 and is currently estimated at $390,308, approximately $227 per square foot. 104 Tyne Blvd is a home located in Wilson County with nearby schools including Lakeview Elementary School, Mt. Juliet Middle School, and Green Hill High School.
Ownership History
Date
Name
Owned For
Owner Type
Purchase Details
Closed on
Jul 5, 2016
Sold by
Babb Sandra
Bought by
Spence Timothy G
Current Estimated Value
Purchase Details
Closed on
Apr 25, 2005
Bought by
Grady Spence Timothy
Home Financials for this Owner
Home Financials are based on the most recent Mortgage that was taken out on this home.
Original Mortgage
$120,670
Interest Rate
5.99%
Purchase Details
Closed on
Apr 19, 2005
Sold by
Sec Of Hud
Bought by
Spence Timothy G
Home Financials for this Owner
Home Financials are based on the most recent Mortgage that was taken out on this home.
Original Mortgage
$120,670
Interest Rate
5.99%
Purchase Details
Closed on
Dec 11, 2000
Sold by
Elrod Clarence C
Bought by
Jeffery Allen
Purchase Details
Closed on
Sep 19, 2000
Sold by
Elrod Elaine C
Bought by
Elrod Clarence C
Purchase Details
Closed on
Jul 12, 1976
Bought by
Elrod Elaine C
Create a Home Valuation Report for This Property
The Home Valuation Report is an in-depth analysis detailing your home's value as well as a comparison with similar homes in the area
Home Values in the Area
Average Home Value in this Area
Purchase History
| Date | Buyer | Sale Price | Title Company |
|---|---|---|---|
| Spence Timothy G | -- | None Available | |
| Grady Spence Timothy | $127,025 | -- | |
| Spence Timothy G | $127,025 | -- | |
| Jeffery Allen | $133,000 | -- | |
| Elrod Clarence C | $115,200 | -- | |
| Elrod Elaine C | -- | -- |
Source: Public Records
Mortgage History
| Date | Status | Borrower | Loan Amount |
|---|---|---|---|
| Previous Owner | Elrod Elaine C | $120,670 |
Source: Public Records
Tax History Compared to Growth
Tax History
| Year | Tax Paid | Tax Assessment Tax Assessment Total Assessment is a certain percentage of the fair market value that is determined by local assessors to be the total taxable value of land and additions on the property. | Land | Improvement |
|---|---|---|---|---|
| 2024 | $1,162 | $60,875 | $13,750 | $47,125 |
| 2022 | $1,162 | $60,875 | $13,750 | $47,125 |
| 2021 | $1,162 | $60,875 | $13,750 | $47,125 |
| 2020 | $1,086 | $60,875 | $13,750 | $47,125 |
| 2019 | $1,086 | $43,100 | $13,400 | $29,700 |
| 2018 | $1,086 | $43,100 | $13,400 | $29,700 |
| 2017 | $1,086 | $43,100 | $13,400 | $29,700 |
| 2016 | $1,086 | $43,100 | $13,400 | $29,700 |
| 2015 | $1,108 | $43,100 | $13,400 | $29,700 |
| 2014 | $1,070 | $41,646 | $0 | $0 |
Source: Public Records
Map
Nearby Homes
- 4610 Woodside Dr
- 4837 Matterhorn Dr
- 4924 Whittier Dr
- 4840 Shasta Dr
- 1320 Autumn Springs Ln
- 1033 Wyntergrace Farm Rd
- 313 Hollywood Dr
- 4852 Everest Dr
- 521 General Kershaw Dr
- 116 Greenwich Ct
- 104 Saddle Tree Ct
- 4768 Cascade Dr
- 208 Lowell Ct
- 290 Brookside Dr
- 5504 W Shady Trail
- 4741 Cascade Dr
- 5128 Brittany Dr
- 220 Harpers Mill Ct Unit 220
- 604 Weatherbeaten Place Unit 604
- 1884 Brookmeadow Ln
- 102 Tyne Blvd
- 106 Tyne Blvd
- 108 Tyne Blvd
- 100 Tyne Blvd
- 107 Tyne Blvd
- 4921 Saundersville Rd
- 110 Tyne Blvd
- 4925 Saundersville Rd
- 109 Tyne Blvd
- 4913 Lakeridge Dr
- 4917 Lakeridge Dr
- 112 Tyne Blvd
- 4912 Saundersville Rd
- 4908 Saundersville Rd
- 111 Tyne Blvd
- 4909 Lakeridge Dr
- 4916 Saundersville Rd
- 4904 Saundersville Rd
- 4921 Lakeridge Dr
- 4929 Saundersville Rd