Estimated Value: $798,856
Studio
2
Baths
2,316
Sq Ft
$345/Sq Ft
Est. Value
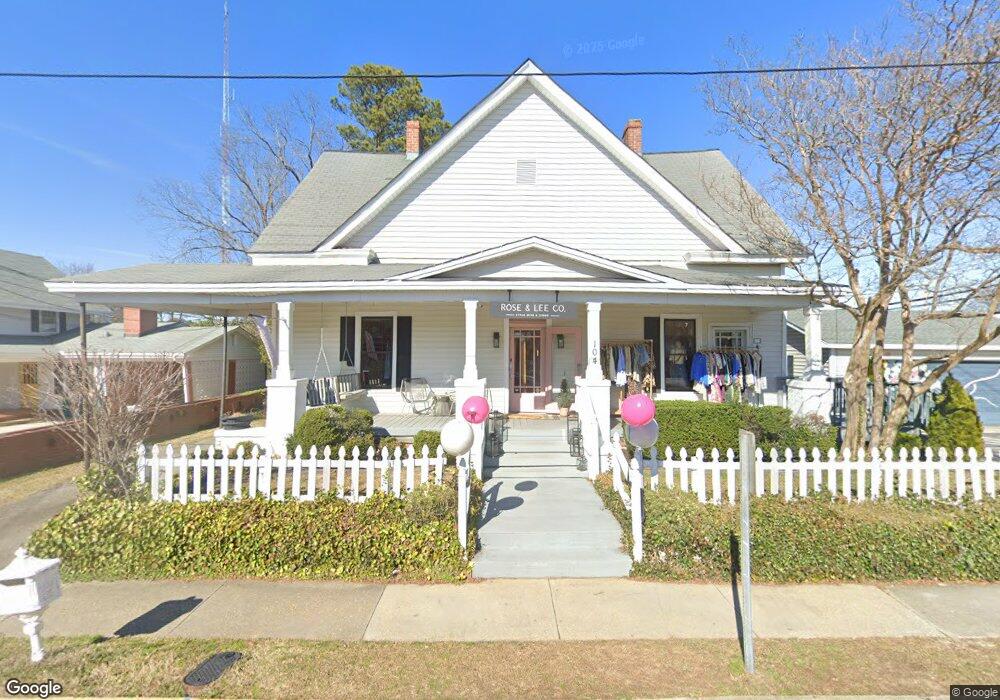
About This Home
This home is located at 104 W Chatham St, Apex, NC 27502 and is currently estimated at $798,856, approximately $344 per square foot. 104 W Chatham St is a home located in Wake County with nearby schools including Baucom Elementary School, Apex Middle, and Apex High School.
Ownership History
Date
Name
Owned For
Owner Type
Purchase Details
Closed on
Jun 11, 2019
Sold by
Kincaid Donna L
Bought by
Brennan Robert Owen and Brennan Amber Rose
Current Estimated Value
Home Financials for this Owner
Home Financials are based on the most recent Mortgage that was taken out on this home.
Original Mortgage
$378,750
Outstanding Balance
$332,339
Interest Rate
4%
Mortgage Type
New Conventional
Estimated Equity
$466,517
Purchase Details
Closed on
Feb 4, 2004
Sold by
Kincaid John S
Bought by
Kincaid Donna L and Murnick Donna
Home Financials for this Owner
Home Financials are based on the most recent Mortgage that was taken out on this home.
Original Mortgage
$165,345
Interest Rate
3.75%
Mortgage Type
Commercial
Create a Home Valuation Report for This Property
The Home Valuation Report is an in-depth analysis detailing your home's value as well as a comparison with similar homes in the area
Purchase History
| Date | Buyer | Sale Price | Title Company |
|---|---|---|---|
| Brennan Robert Owen | $505,000 | None Available | |
| Kincaid Donna L | -- | -- |
Source: Public Records
Mortgage History
| Date | Status | Borrower | Loan Amount |
|---|---|---|---|
| Open | Brennan Robert Owen | $378,750 | |
| Previous Owner | Kincaid Donna L | $165,345 |
Source: Public Records
Tax History
| Year | Tax Paid | Tax Assessment Tax Assessment Total Assessment is a certain percentage of the fair market value that is determined by local assessors to be the total taxable value of land and additions on the property. | Land | Improvement |
|---|---|---|---|---|
| 2025 | $4,718 | $540,383 | $195,401 | $344,982 |
| 2024 | $4,612 | $540,383 | $195,401 | $344,982 |
| 2023 | $4,766 | $434,469 | $146,551 | $287,918 |
| 2022 | $4,473 | $434,469 | $146,551 | $287,918 |
| 2021 | $4,301 | $434,469 | $146,551 | $287,918 |
| 2020 | $4,258 | $434,469 | $146,551 | $287,918 |
| 2019 | $2,537 | $223,355 | $64,036 | $159,319 |
| 2018 | $2,389 | $223,355 | $64,036 | $159,319 |
| 2017 | $2,222 | $223,355 | $64,036 | $159,319 |
| 2016 | $2,190 | $223,355 | $64,036 | $159,319 |
| 2015 | $2,194 | $218,399 | $59,462 | $158,937 |
| 2014 | $2,114 | $218,399 | $59,462 | $158,937 |
Source: Public Records
Map
Nearby Homes
- 300 Pate St
- 901 Woodbriar St
- 309 Culvert St
- 311 Culvert St
- 307 S Elm St
- 506 W Chatham St
- 212 Hunter St
- 105 Cunningham St
- 302 Center Park Way
- 540 Old Mill Village Dr
- 547 Grand Central Station
- 616 Bladestone Ct
- 415 Fairview Rd
- 104 Fair Spring Ct
- 302 Center Heights Ct
- 578 Metro Station
- 313 Great Northern Station
- 618 Metro Station
- 345 Great Northern Station
- 514 Mill Hopper Ln
- 108 W Chatham St
- 103 N. Sal N Salem St N Unit downstairs
- 103 N Salem St Unit downstairs
- 103 N Salem St
- 200 W Chatham St
- 123 N Salem St
- 125 N Salem St
- 108 B N Salem St
- 206 W Chatham St
- 207 W Chatham St
- 103 S Salem St
- 113 S Salem St
- 201 N Salem St
- 126 N Salem St Unit 200
- 126 N Salem St
- 126 N Salem St Unit 202
- 126 N Salem St Unit 205
- 126 N Salem St Unit 205
- 126 N Salem St Unit 202
- 126 N Salem St Unit 200
Your Personal Tour Guide
Ask me questions while you tour the home.