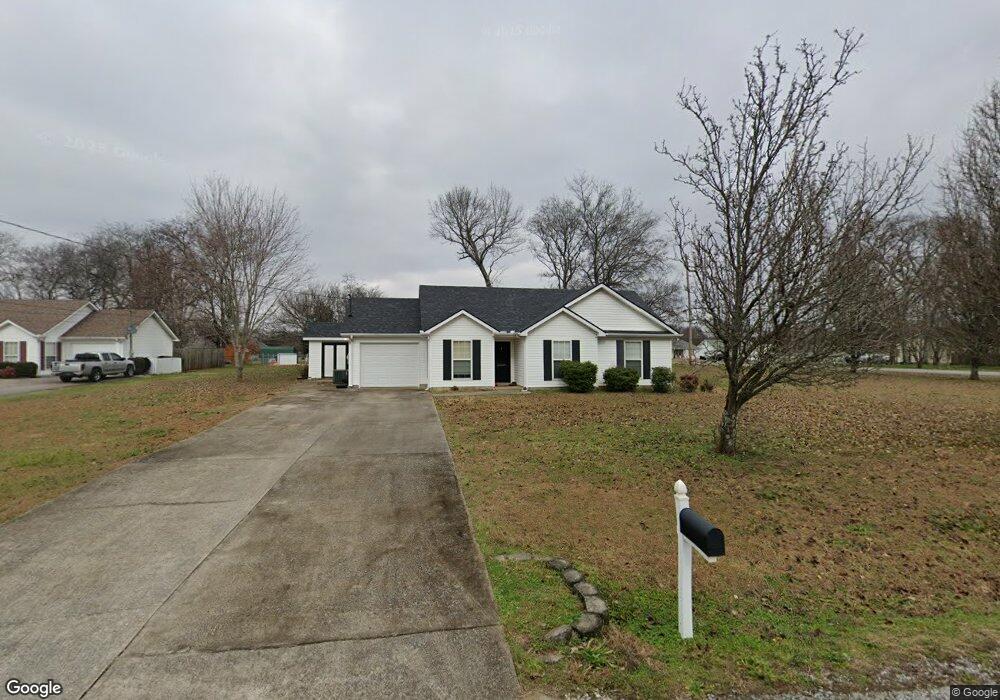
104 Windy Cove Dr Murfreesboro, TN 37130
Estimated Value: $308,968 - $351,000
--
Bed
2
Baths
1,207
Sq Ft
$276/Sq Ft
Est. Value
About This Home
This home is located at 104 Windy Cove Dr, Murfreesboro, TN 37130 and is currently estimated at $332,742, approximately $275 per square foot. 104 Windy Cove Dr is a home located in Rutherford County with nearby schools including Walter Hill Elementary School, Oakland Middle School, and Oakland High School.
Ownership History
Date
Name
Owned For
Owner Type
Purchase Details
Closed on
Jul 10, 2019
Sold by
Starks G Mark and Starks Jennifer
Bought by
Starks Jacob
Current Estimated Value
Home Financials for this Owner
Home Financials are based on the most recent Mortgage that was taken out on this home.
Original Mortgage
$175,000
Interest Rate
3.9%
Mortgage Type
New Conventional
Purchase Details
Closed on
Jun 3, 2004
Sold by
Robinson Gregory B
Bought by
Mark Starks G
Home Financials for this Owner
Home Financials are based on the most recent Mortgage that was taken out on this home.
Original Mortgage
$86,832
Interest Rate
6.85%
Purchase Details
Closed on
Oct 28, 2002
Sold by
Bugg Sandra N
Bought by
Robinson Gregory B
Home Financials for this Owner
Home Financials are based on the most recent Mortgage that was taken out on this home.
Original Mortgage
$93,400
Interest Rate
5.93%
Purchase Details
Closed on
Oct 12, 2000
Sold by
Bugg Kirk D
Bought by
Robinson Gregory B
Create a Home Valuation Report for This Property
The Home Valuation Report is an in-depth analysis detailing your home's value as well as a comparison with similar homes in the area
Home Values in the Area
Average Home Value in this Area
Purchase History
| Date | Buyer | Sale Price | Title Company |
|---|---|---|---|
| Starks Jacob | $175,000 | Gateway Title Services Llc | |
| Mark Starks G | $108,540 | -- | |
| Robinson Gregory B | -- | -- | |
| Robinson Gregory B | $92,750 | -- |
Source: Public Records
Mortgage History
| Date | Status | Borrower | Loan Amount |
|---|---|---|---|
| Open | Starks Jacob | $15,598 | |
| Open | Starks Jacob | $194,500 | |
| Closed | Starks Jacob | $175,000 | |
| Previous Owner | Robinson Gregory B | $86,832 | |
| Previous Owner | Robinson Gregory B | $93,400 |
Source: Public Records
Tax History Compared to Growth
Tax History
| Year | Tax Paid | Tax Assessment Tax Assessment Total Assessment is a certain percentage of the fair market value that is determined by local assessors to be the total taxable value of land and additions on the property. | Land | Improvement |
|---|---|---|---|---|
| 2025 | $1,136 | $60,525 | $13,750 | $46,775 |
| 2024 | $1,136 | $60,525 | $13,750 | $46,775 |
| 2023 | $1,136 | $60,525 | $13,750 | $46,775 |
| 2022 | $981 | $60,725 | $13,750 | $46,975 |
| 2021 | $896 | $40,375 | $8,750 | $31,625 |
| 2020 | $896 | $40,375 | $8,750 | $31,625 |
| 2019 | $896 | $40,375 | $8,750 | $31,625 |
| 2018 | $828 | $39,450 | $0 | $0 |
| 2017 | $798 | $29,775 | $0 | $0 |
| 2016 | $798 | $29,775 | $0 | $0 |
| 2015 | $798 | $29,775 | $0 | $0 |
| 2014 | $740 | $29,775 | $0 | $0 |
| 2013 | -- | $29,850 | $0 | $0 |
Source: Public Records
Map
Nearby Homes
- 111 Ridgepark Ct
- 7431 Antietam Ln
- 102 Marcus Cir
- 105 Dominic Cir
- 336 Royal Garden Dr
- 365 Royal Garden Dr
- 6923 Riverwalk Blvd
- 6834 Riverwalk Blvd
- 6439 Wade Springs Rd
- 3023 Barretts Ridge Dr
- 3014 Barretts Ridge Dr
- 6464 Lebanon Rd
- 1505 Martha Washington Way
- 1509 Martha Washington Way
- 1501 Martha Washington Way
- 1611 Martha Washington Way
- 308 Amazonway Ridge
- 1709 Martha Washington Way
- 1900 Martha Washington Way
- 2326 Holly Grove Rd
- 7511 Appomattox Dr
- 108 Windy Cove Dr
- 7429 Appomattox Dr
- 7504 Appomattox Dr
- 109 Windy Cove Dr
- 7500 Appomattox Dr
- 112 Windy Cove Dr
- 108 Cypress Gardens Dr
- 103 Royal Garden Dr
- 105 Cypress Gardens Dr
- 7425 Appomattox Dr
- 107 Royal Garden Dr
- 111 Royal Garden Dr
- 116 Windy Cove Dr
- 7426 Appomattox Dr
- 108 S Sunny Ridge Ct
- 7421 Appomattox Dr
- 115 Royal Garden Dr
- 112 S Sunny Ridge Ct
- 117 Windy Cove Dr