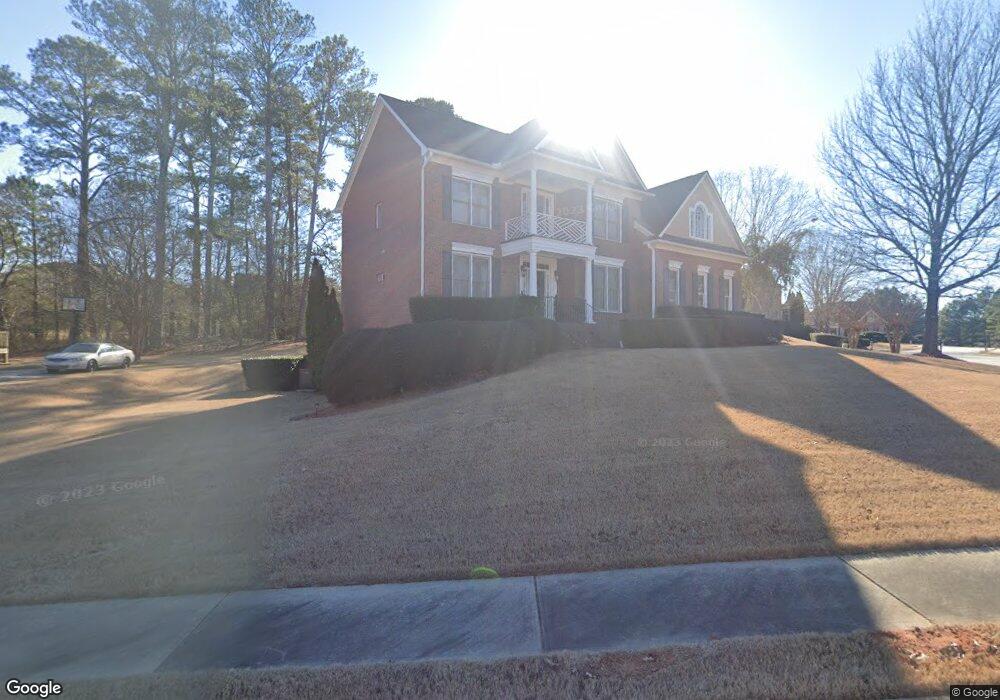
104 Wynfield Dr Tyrone, GA 30290
Estimated Value: $530,744 - $633,000
5
Beds
4
Baths
2,896
Sq Ft
$204/Sq Ft
Est. Value
About This Home
This home is located at 104 Wynfield Dr, Tyrone, GA 30290 and is currently estimated at $592,186, approximately $204 per square foot. 104 Wynfield Dr is a home located in Fayette County with nearby schools including Robert J. Burch Elementary School, Flat Rock Middle School, and Sandy Creek High School.
Ownership History
Date
Name
Owned For
Owner Type
Purchase Details
Closed on
May 9, 2025
Sold by
Scott Sheila
Bought by
Scott Family Living Trust and Scott
Current Estimated Value
Purchase Details
Closed on
Sep 2, 2010
Sold by
Bank Of Ny Trust 2005-Ar7
Bought by
Scott Sheila
Home Financials for this Owner
Home Financials are based on the most recent Mortgage that was taken out on this home.
Original Mortgage
$232,750
Interest Rate
4.37%
Mortgage Type
New Conventional
Purchase Details
Closed on
Apr 6, 2010
Sold by
Jones Robert M
Bought by
Mortgage Invs Trust 2005-Ar7
Purchase Details
Closed on
Aug 9, 2005
Sold by
Flanigan Jeffrey and Flanigan Krisin
Bought by
Jones Robert M
Home Financials for this Owner
Home Financials are based on the most recent Mortgage that was taken out on this home.
Original Mortgage
$279,900
Interest Rate
1%
Mortgage Type
New Conventional
Create a Home Valuation Report for This Property
The Home Valuation Report is an in-depth analysis detailing your home's value as well as a comparison with similar homes in the area
Home Values in the Area
Average Home Value in this Area
Purchase History
| Date | Buyer | Sale Price | Title Company |
|---|---|---|---|
| Scott Family Living Trust | -- | None Listed On Document | |
| Scott Family Living Trust | -- | None Listed On Document | |
| Scott Sheila | $245,000 | -- | |
| Mortgage Invs Trust 2005-Ar7 | $358,187 | -- | |
| Jones Robert M | $349,900 | -- |
Source: Public Records
Mortgage History
| Date | Status | Borrower | Loan Amount |
|---|---|---|---|
| Previous Owner | Scott Sheila | $232,750 | |
| Previous Owner | Jones Robert M | $279,900 |
Source: Public Records
Tax History
| Year | Tax Paid | Tax Assessment Tax Assessment Total Assessment is a certain percentage of the fair market value that is determined by local assessors to be the total taxable value of land and additions on the property. | Land | Improvement |
|---|---|---|---|---|
| 2025 | $4,891 | $217,604 | $34,240 | $183,364 |
| 2024 | $4,763 | $203,368 | $32,000 | $171,368 |
| 2023 | $4,073 | $176,440 | $32,000 | $144,440 |
| 2022 | $4,396 | $170,520 | $32,000 | $138,520 |
| 2021 | $4,129 | $149,040 | $24,000 | $125,040 |
| 2020 | $4,322 | $140,880 | $24,000 | $116,880 |
| 2019 | $4,127 | $133,360 | $24,000 | $109,360 |
| 2018 | $3,755 | $120,320 | $24,000 | $96,320 |
| 2017 | $3,913 | $124,840 | $24,000 | $100,840 |
| 2016 | $3,317 | $104,160 | $14,400 | $89,760 |
| 2015 | $3,078 | $95,280 | $14,400 | $80,880 |
| 2014 | $2,979 | $90,760 | $14,400 | $76,360 |
| 2013 | -- | $88,560 | $0 | $0 |
Source: Public Records
Map
Nearby Homes
- 109 Hampshire Trace
- 403 Carriage Oaks Dr
- 115 Westmont Way
- 125 Meadowview Cir
- 131 Lincoln Rd
- 0 Georgia 74
- 0 Erwin Run Unit 10585589
- 215 Berry Hill Ln
- 365 Pendleton Trail
- 100 Brookmont Place
- 195 Goodlin Rd
- 140 Julie Rd
- 242 Kirkley Rd
- 110 Sunflower St
- 535 Laurelwood Dr
- 345 Gaelic Way
- 105 Laurel Forest Dr
- 230 Gaelic Way
- 6688 Jules Trace
- 6683 Jules Trc
- 102 Hampshire Trace
- 102 Wynfield Dr
- 103 Wynfield Dr
- 106 Wynfield Dr
- 103 Hampshire Trace
- 104 Hampshire Trace
- 105 Wynfield Dr
- 298 Carriage Oaks Dr
- 296 Carriage Oaks Dr
- 101 Wynfield Dr
- 294 Carriage Oaks Dr
- 108 Wynfield Dr
- 105 Hampshire Trace
- 106 Hampshire Trace
- 107 Wynfield Dr
- 292 Carriage Oaks Dr
- 302 Carriage Oaks Dr
- 290 Carriage Oaks Dr
- 305 Carriage Oaks Dr
- 304 Carriage Oaks Dr
Your Personal Tour Guide
Ask me questions while you tour the home.