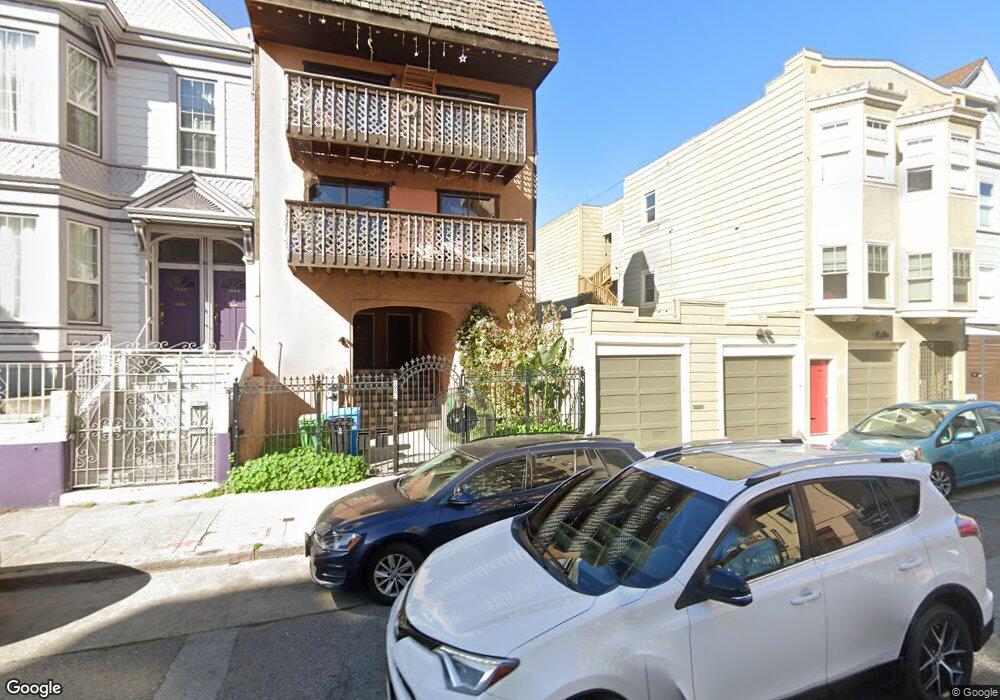
1040 Capp St Unit 1042 San Francisco, CA 94110
Inner Mission NeighborhoodEstimated Value: $1,323,000 - $1,576,000
--
Bed
4
Baths
2,650
Sq Ft
$561/Sq Ft
Est. Value
About This Home
This home is located at 1040 Capp St Unit 1042, San Francisco, CA 94110 and is currently estimated at $1,485,737, approximately $560 per square foot. 1040 Capp St Unit 1042 is a home located in San Francisco County with nearby schools including César Chávez Elementary School, Everett Middle School, and Katherine Michiels School.
Ownership History
Date
Name
Owned For
Owner Type
Purchase Details
Closed on
Jan 26, 1999
Sold by
Ibrahim and Rany
Bought by
Ibrahim Eyad A and Ibrahim Rany Sameeh
Current Estimated Value
Home Financials for this Owner
Home Financials are based on the most recent Mortgage that was taken out on this home.
Original Mortgage
$157,000
Interest Rate
6.73%
Mortgage Type
Commercial
Purchase Details
Closed on
Jun 20, 1997
Sold by
Ibrahim Eyad A and Ibrahim Rany Sameeh
Bought by
Ibrahim Eyad A and Ibrahim Rany Sameeh
Purchase Details
Closed on
Jul 1, 1996
Sold by
Home Svgs Of America Fsb
Bought by
Ibrahim Eyad A and Ibrahim Rany S
Home Financials for this Owner
Home Financials are based on the most recent Mortgage that was taken out on this home.
Original Mortgage
$160,000
Interest Rate
8.03%
Mortgage Type
Commercial
Purchase Details
Closed on
Dec 7, 1995
Sold by
Frank Melvin and Norman Ron
Bought by
Home Svgs Of America
Create a Home Valuation Report for This Property
The Home Valuation Report is an in-depth analysis detailing your home's value as well as a comparison with similar homes in the area
Home Values in the Area
Average Home Value in this Area
Purchase History
| Date | Buyer | Sale Price | Title Company |
|---|---|---|---|
| Ibrahim Eyad A | -- | Financial Title Company | |
| Ibrahim Eyad A | -- | Old Republic Title Company | |
| Ibrahim Eyad A | -- | -- | |
| Ibrahim Eyad A | $230,000 | Fidelity National Title Co | |
| Home Svgs Of America | $261,000 | Fidelity National Title Ins |
Source: Public Records
Mortgage History
| Date | Status | Borrower | Loan Amount |
|---|---|---|---|
| Closed | Ibrahim Eyad A | $157,000 | |
| Closed | Ibrahim Eyad A | $160,000 |
Source: Public Records
Tax History Compared to Growth
Tax History
| Year | Tax Paid | Tax Assessment Tax Assessment Total Assessment is a certain percentage of the fair market value that is determined by local assessors to be the total taxable value of land and additions on the property. | Land | Improvement |
|---|---|---|---|---|
| 2025 | $5,305 | $374,574 | $130,282 | $244,292 |
| 2024 | $5,305 | $367,230 | $127,728 | $239,502 |
| 2023 | $5,126 | $360,030 | $125,224 | $234,806 |
| 2022 | $5,001 | $352,971 | $122,769 | $230,202 |
| 2021 | $4,910 | $346,051 | $120,362 | $225,689 |
| 2020 | $5,049 | $342,503 | $119,128 | $223,375 |
| 2019 | $4,887 | $335,789 | $116,793 | $218,996 |
| 2018 | $4,721 | $329,205 | $114,503 | $214,702 |
| 2017 | $4,370 | $322,751 | $112,258 | $210,493 |
| 2016 | $4,267 | $316,423 | $110,057 | $206,366 |
| 2015 | $4,209 | $311,671 | $108,404 | $203,267 |
| 2014 | $4,103 | $305,567 | $106,281 | $199,286 |
Source: Public Records
Map
Nearby Homes
- 1030 Capp St
- 980 Capp St
- 3328 26th St
- 3418 26th St Unit 1
- 370 Bartlett St Unit 3
- 3117 3119 N 24th St
- 3779 3781 25th St
- 1206 1208 Utah St
- 2950 2952 25th St
- 3340-3342 24th St
- 3164 24th St
- 3390 Cesar Chavez
- 1350 Shotwell St
- 340 San Jose Ave
- 350 San Jose Ave Unit 7
- 350 San Jose Ave Unit 4
- 350 San Jose Ave Unit 5
- 350 San Jose Ave Unit 12
- 350 San Jose Ave Unit 6
- 1298 Treat Ave
- 1044 Capp St Unit 1046
- 1030 Capp St Unit 1024
- 1030 Capp St
- 1032 Capp St Unit A
- 1032 Capp St Unit A
- 1052 Capp St
- 1026 Capp St Unit 1028
- 1026 Capp St Unit 1026
- 1026 Capp St
- 1026, 1028 1026a Capp St
- 1026, 1028 1028a Capp St
- 1026 Capp St
- 1056 Capp St Unit 1058
- 1018 Capp St Unit 1020
- 1012-1014 Capp St
- 1012 Capp St
- 115 Lilac St
- 1060 Capp St
- 1006 Capp St Unit 1010
- 2949 Mission St