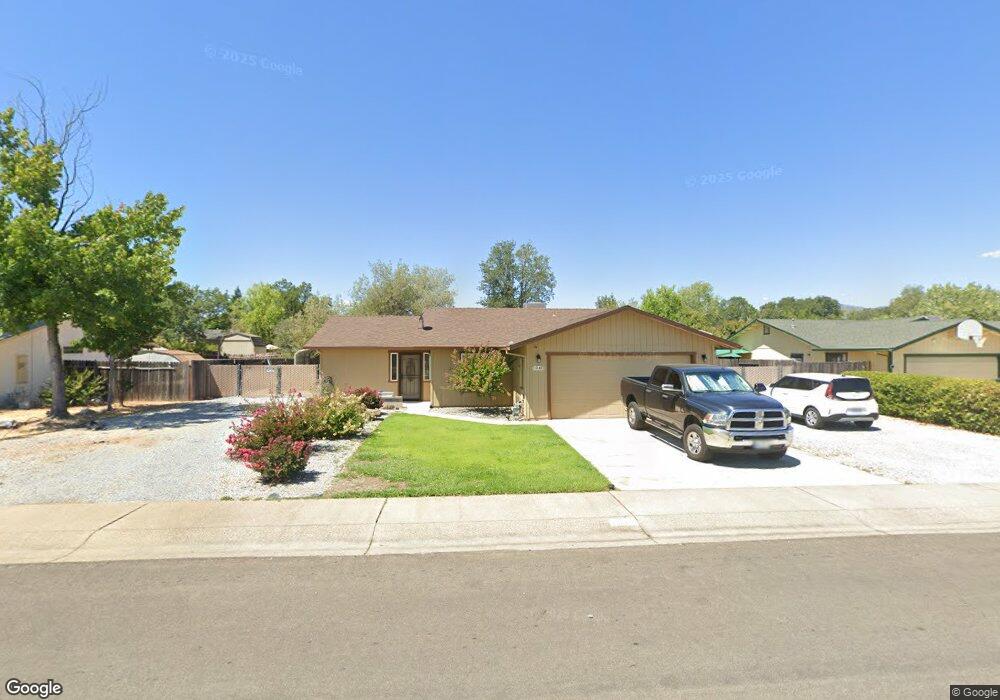
1040 Dara Ct Redding, CA 96003
Buckeye NeighborhoodEstimated Value: $276,000 - $379,000
3
Beds
2
Baths
1,200
Sq Ft
$273/Sq Ft
Est. Value
About This Home
This home is located at 1040 Dara Ct, Redding, CA 96003 and is currently estimated at $327,156, approximately $272 per square foot. 1040 Dara Ct is a home located in Shasta County with nearby schools including Rocky Point Charter School.
Ownership History
Date
Name
Owned For
Owner Type
Purchase Details
Closed on
Nov 8, 2016
Sold by
Bacani Michael
Bought by
Bacani Michael and Bacani Patricia J
Current Estimated Value
Home Financials for this Owner
Home Financials are based on the most recent Mortgage that was taken out on this home.
Original Mortgage
$85,000
Outstanding Balance
$68,240
Interest Rate
3.42%
Mortgage Type
New Conventional
Estimated Equity
$258,916
Purchase Details
Closed on
Apr 25, 2012
Sold by
Bacani Michael and Bacani Patrica J
Bought by
Bacani Michael
Purchase Details
Closed on
Apr 12, 2011
Sold by
Dicristina Gary Roy and Di Cristina Kimberly Ann
Bought by
Bacani Michael and Bacani Patricia J
Home Financials for this Owner
Home Financials are based on the most recent Mortgage that was taken out on this home.
Original Mortgage
$62,367
Interest Rate
4.83%
Mortgage Type
FHA
Create a Home Valuation Report for This Property
The Home Valuation Report is an in-depth analysis detailing your home's value as well as a comparison with similar homes in the area
Home Values in the Area
Average Home Value in this Area
Purchase History
| Date | Buyer | Sale Price | Title Company |
|---|---|---|---|
| Bacani Michael | -- | First American Title Company | |
| Bacani Michael | -- | None Available | |
| Bacani Michael | $127,000 | Fidelity Natl Title Co Of Ca |
Source: Public Records
Mortgage History
| Date | Status | Borrower | Loan Amount |
|---|---|---|---|
| Open | Bacani Michael | $85,000 | |
| Closed | Bacani Michael | $62,367 |
Source: Public Records
Tax History Compared to Growth
Tax History
| Year | Tax Paid | Tax Assessment Tax Assessment Total Assessment is a certain percentage of the fair market value that is determined by local assessors to be the total taxable value of land and additions on the property. | Land | Improvement |
|---|---|---|---|---|
| 2025 | $1,890 | $180,984 | $38,430 | $142,554 |
| 2024 | $1,852 | $177,436 | $37,677 | $139,759 |
| 2023 | $1,852 | $173,958 | $36,939 | $137,019 |
| 2022 | $1,685 | $159,764 | $36,215 | $123,549 |
| 2021 | $1,661 | $156,632 | $35,505 | $121,127 |
| 2020 | $1,653 | $155,026 | $35,141 | $119,885 |
| 2019 | $1,601 | $151,987 | $34,452 | $117,535 |
| 2018 | $1,600 | $149,008 | $33,777 | $115,231 |
| 2017 | $1,495 | $139,087 | $33,115 | $105,972 |
| 2016 | $1,428 | $136,361 | $32,466 | $103,895 |
| 2015 | $1,405 | $134,314 | $31,979 | $102,335 |
| 2014 | $1,414 | $131,684 | $31,353 | $100,331 |
Source: Public Records
Map
Nearby Homes
- 1070 Dara Ct
- 3105 Jordan Ln
- 3291 Keswick Dam Rd
- 940 Golden Heights Ct
- 3671 Santa Rosa Way
- 1450 Greenback Ln
- 3588 Magnums Way
- 1450 Calexico Dr
- 3505 Tamarack Dr
- 3639 E Keswick Dam Rd
- 3082, 3060 Keswick Dam Rd
- 17400 Pittim Dr
- 820 Middle St
- 3488 Oasis Rd
- 3757 Magnums Way
- 11512 Profanity Ln
- 1702/1720 Mckinney Ln
- 605 Quartz Hill Rd
- 729 July Way
- 2935 Quartz Hill Rd