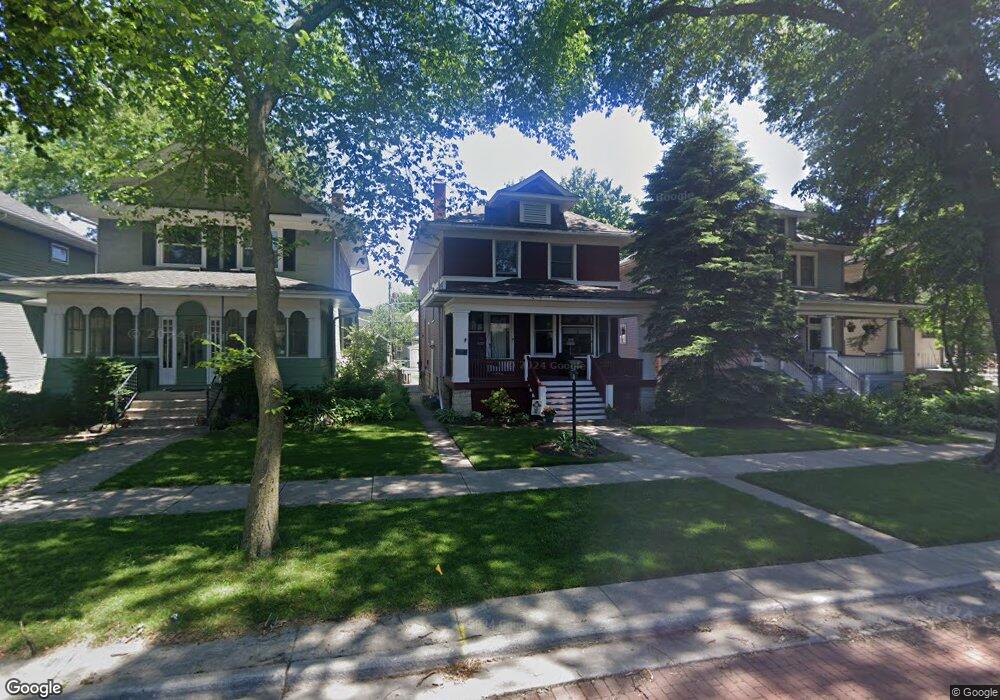
1040 Wenonah Ave Oak Park, IL 60304
Estimated Value: $574,000 - $729,262
4
Beds
3
Baths
2,262
Sq Ft
$288/Sq Ft
Est. Value
About This Home
This home is located at 1040 Wenonah Ave, Oak Park, IL 60304 and is currently estimated at $651,816, approximately $288 per square foot. 1040 Wenonah Ave is a home located in Cook County with nearby schools including Abraham Lincoln Elementary School, Gwendolyn Brooks Middle School, and Oak Park and River Forest High School.
Create a Home Valuation Report for This Property
The Home Valuation Report is an in-depth analysis detailing your home's value as well as a comparison with similar homes in the area
Home Values in the Area
Average Home Value in this Area
Tax History Compared to Growth
Tax History
| Year | Tax Paid | Tax Assessment Tax Assessment Total Assessment is a certain percentage of the fair market value that is determined by local assessors to be the total taxable value of land and additions on the property. | Land | Improvement |
|---|---|---|---|---|
| 2024 | $17,214 | $54,563 | $7,875 | $46,688 |
| 2023 | $14,982 | $58,770 | $7,875 | $50,895 |
| 2022 | $14,982 | $42,437 | $5,906 | $36,531 |
| 2021 | $14,634 | $42,437 | $5,906 | $36,531 |
| 2020 | $15,350 | $45,152 | $5,906 | $39,246 |
| 2019 | $15,852 | $44,747 | $5,343 | $39,404 |
| 2018 | $15,255 | $44,747 | $5,343 | $39,404 |
| 2017 | $14,943 | $44,747 | $5,343 | $39,404 |
| 2016 | $14,029 | $37,353 | $4,500 | $32,853 |
| 2015 | $12,524 | $37,353 | $4,500 | $32,853 |
| 2014 | $11,656 | $37,353 | $4,500 | $32,853 |
| 2013 | $11,688 | $38,543 | $4,500 | $34,043 |
Source: Public Records
Map
Nearby Homes
- 1103 S Clinton Ave
- 1032 S Maple Ave
- 1143 Clinton Ave
- 1122 S Maple Ave
- 1014 S Kenilworth Ave
- 1005 S Harlem Ave
- 839 S Harlem Ave
- 1101 Harlem Ave Unit 203
- 902 S Kenilworth Ave
- 7011 Roosevelt Rd
- 1101 S Oak Park Ave
- 830 Elgin Ave
- 820 Elgin Ave
- 1007 S Oak Park Ave Unit E
- 1216 Wenonah Ave
- 929 S Oak Park Ave Unit 1NE
- 1135 S Oak Park Ave
- 915 S Oak Park Ave Unit 1-B
- 941 Marengo Ave
- 937 Marengo Ave
- 1036 Wenonah Ave
- 1042 Wenonah Ave
- 1034 Wenonah Ave
- 1046 Wenonah Ave
- 1030 Wenonah Ave
- 1028 Wenonah Ave
- 1041 Home Ave
- 1039 Home Ave
- 1043 Home Ave
- 1100 Wenonah Ave
- 1035 Home Ave
- 1047 Home Ave
- 1024 Wenonah Ave
- 1037 Wenonah Ave
- 1031 Home Ave
- 1041 Wenonah Ave
- 1104 Wenonah Ave
- 1043 Wenonah Ave
- 1029 Home Ave
- 1022 Wenonah Ave