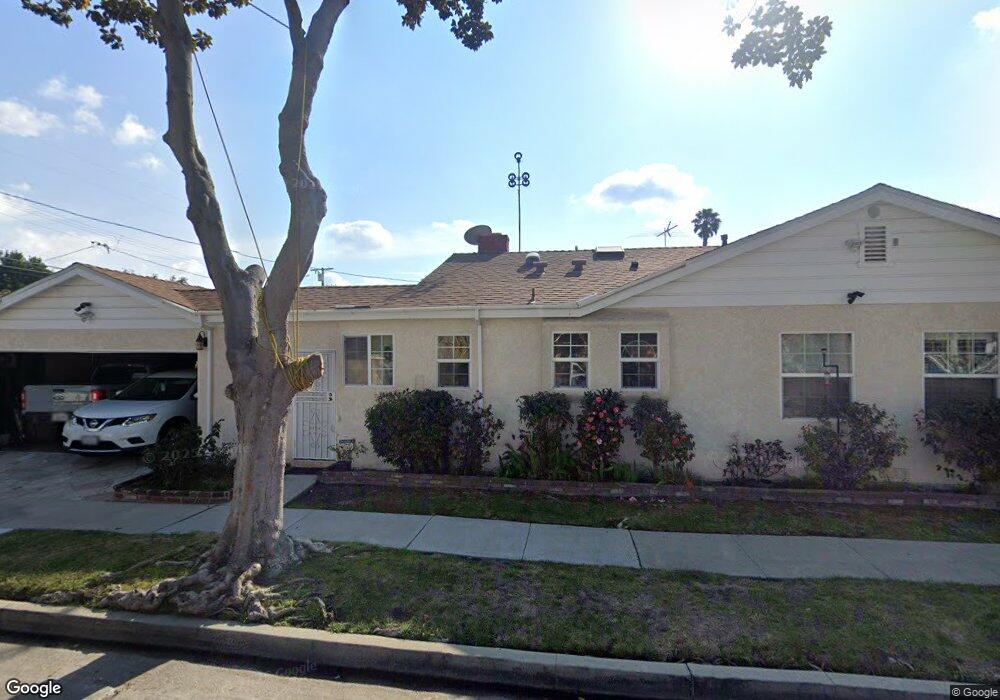
10400 Washington Ave South Gate, CA 90280
Estimated Value: $631,790 - $725,000
2
Beds
2
Baths
1,290
Sq Ft
$539/Sq Ft
Est. Value
About This Home
This home is located at 10400 Washington Ave, South Gate, CA 90280 and is currently estimated at $695,198, approximately $538 per square foot. 10400 Washington Ave is a home located in Los Angeles County with nearby schools including Bryson Avenue Elementary School, South Gate Middle School, and Southeast Middle School.
Ownership History
Date
Name
Owned For
Owner Type
Purchase Details
Closed on
Sep 18, 2012
Sold by
Cruz Jesus A
Bought by
Cruz Jesus A and Cruz Mimi B
Current Estimated Value
Home Financials for this Owner
Home Financials are based on the most recent Mortgage that was taken out on this home.
Original Mortgage
$178,500
Outstanding Balance
$123,631
Interest Rate
3.59%
Mortgage Type
New Conventional
Estimated Equity
$571,567
Purchase Details
Closed on
Mar 11, 1997
Sold by
Duffey Betty
Bought by
Cruz Jesus A
Home Financials for this Owner
Home Financials are based on the most recent Mortgage that was taken out on this home.
Original Mortgage
$12,000
Interest Rate
7.96%
Purchase Details
Closed on
Sep 8, 1993
Sold by
Weaver Dorotha E
Bought by
Duffey Betty
Home Financials for this Owner
Home Financials are based on the most recent Mortgage that was taken out on this home.
Original Mortgage
$139,500
Interest Rate
6.81%
Create a Home Valuation Report for This Property
The Home Valuation Report is an in-depth analysis detailing your home's value as well as a comparison with similar homes in the area
Home Values in the Area
Average Home Value in this Area
Purchase History
| Date | Buyer | Sale Price | Title Company |
|---|---|---|---|
| Cruz Jesus A | -- | Fidelity National Title Co | |
| Cruz Jesus A | -- | -- | |
| Duffey Betty | $175,000 | Investors Title Company |
Source: Public Records
Mortgage History
| Date | Status | Borrower | Loan Amount |
|---|---|---|---|
| Open | Cruz Jesus A | $178,500 | |
| Previous Owner | Cruz Jesus A | $12,000 | |
| Previous Owner | Duffey Betty | $139,500 |
Source: Public Records
Tax History
| Year | Tax Paid | Tax Assessment Tax Assessment Total Assessment is a certain percentage of the fair market value that is determined by local assessors to be the total taxable value of land and additions on the property. | Land | Improvement |
|---|---|---|---|---|
| 2025 | $3,732 | $268,196 | $150,673 | $117,523 |
| 2024 | $3,732 | $262,938 | $147,719 | $115,219 |
| 2023 | $3,671 | $257,783 | $144,823 | $112,960 |
| 2022 | $3,503 | $252,730 | $141,984 | $110,746 |
| 2021 | $3,459 | $247,775 | $139,200 | $108,575 |
| 2019 | $3,353 | $240,427 | $135,072 | $105,355 |
| 2018 | $3,249 | $235,714 | $132,424 | $103,290 |
| 2016 | $3,099 | $226,563 | $127,283 | $99,280 |
| 2015 | $3,051 | $223,161 | $125,372 | $97,789 |
| 2014 | $3,053 | $218,791 | $122,917 | $95,874 |
Source: Public Records
Map
Nearby Homes
- 10309 Washington Ave
- 10525 Washington Ave
- 10414 Dorothy Ave
- 10240 Atlantic Ave
- 9929 Rosewood Ave
- 5201 Anahurst Rd
- 5301 Aldrich Rd
- 3813 Lyndora St
- 9415 Annetta Ave
- 10845 Otis St
- 10930 Otis St
- 10130 Mallison Ave
- 9616 Bowman Ave
- 9505 Bryson Ave
- 4087 Abbott Rd
- 9718 Otis St
- 11267 Sampson Ave
- 11022 Benwell Dr
- 9525 Bowman Ave
- 10970 Ruth St
- 10410 Washington Ave
- 10414 Washington Ave
- 10346 Washington Ave
- 10418 Washington Ave
- 10340 Washington Ave
- 10407 Orange Ave
- 10411 Orange Ave
- 10347 Orange Ave
- 10415 Orange Ave
- 10336 Washington Ave
- 10424 Washington Ave
- 10341 Orange Ave
- 10419 Orange Ave
- 10407 Washington Ave
- 10411 Washington Ave
- 10415 Washington Ave
- 10332 Washington Ave
- 10347 Washington Ave
- 10337 Orange Ave
- 10428 Washington Ave
Your Personal Tour Guide
Ask me questions while you tour the home.