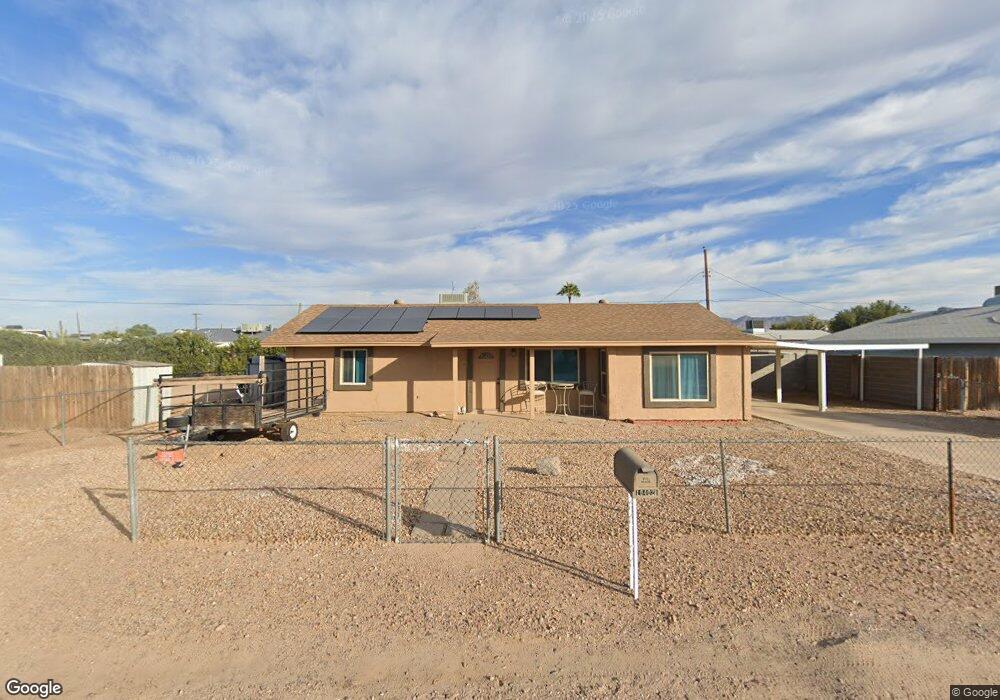
10402 E Albany St Apache Junction, AZ 85120
University Manor NeighborhoodEstimated Value: $267,391 - $369,000
3
Beds
1
Bath
1,225
Sq Ft
$262/Sq Ft
Est. Value
About This Home
This home is located at 10402 E Albany St, Apache Junction, AZ 85120 and is currently estimated at $320,848, approximately $261 per square foot. 10402 E Albany St is a home located in Maricopa County with nearby schools including Sousa Elementary School, Franklin at Brimhall Elementary School, and Franklin West Elementary School.
Ownership History
Date
Name
Owned For
Owner Type
Purchase Details
Closed on
Jun 26, 2009
Sold by
Lindley Thelma B
Bought by
Brumley Ronnie Joe and Brumley Paula Renee
Current Estimated Value
Home Financials for this Owner
Home Financials are based on the most recent Mortgage that was taken out on this home.
Original Mortgage
$76,612
Interest Rate
5.09%
Mortgage Type
VA
Purchase Details
Closed on
Jul 7, 1999
Sold by
Wendt Michelle
Bought by
Lindley Thelma
Home Financials for this Owner
Home Financials are based on the most recent Mortgage that was taken out on this home.
Original Mortgage
$87,270
Interest Rate
7.51%
Mortgage Type
FHA
Purchase Details
Closed on
Apr 19, 1997
Sold by
Valdez Shannon Wendt
Bought by
Wendt Michelle
Create a Home Valuation Report for This Property
The Home Valuation Report is an in-depth analysis detailing your home's value as well as a comparison with similar homes in the area
Home Values in the Area
Average Home Value in this Area
Purchase History
| Date | Buyer | Sale Price | Title Company |
|---|---|---|---|
| Brumley Ronnie Joe | $76,000 | First American Title Insuran | |
| Lindley Thelma | $88,000 | -- | |
| Wendt Michelle | $33,088 | -- |
Source: Public Records
Mortgage History
| Date | Status | Borrower | Loan Amount |
|---|---|---|---|
| Previous Owner | Brumley Ronnie Joe | $76,612 | |
| Previous Owner | Lindley Thelma | $87,270 |
Source: Public Records
Tax History
| Year | Tax Paid | Tax Assessment Tax Assessment Total Assessment is a certain percentage of the fair market value that is determined by local assessors to be the total taxable value of land and additions on the property. | Land | Improvement |
|---|---|---|---|---|
| 2025 | $914 | $12,262 | -- | -- |
| 2024 | $935 | $11,678 | -- | -- |
| 2023 | $935 | $21,580 | $4,310 | $17,270 |
| 2022 | $911 | $16,400 | $3,280 | $13,120 |
| 2021 | $921 | $14,620 | $2,920 | $11,700 |
| 2020 | $449 | $11,510 | $2,300 | $9,210 |
| 2019 | $411 | $10,350 | $2,070 | $8,280 |
| 2018 | $400 | $9,110 | $1,820 | $7,290 |
| 2017 | $385 | $6,550 | $1,310 | $5,240 |
| 2016 | $377 | $5,660 | $1,130 | $4,530 |
| 2015 | $354 | $4,760 | $950 | $3,810 |
Source: Public Records
Map
Nearby Homes
- 146 N Merrill Rd Unit 163
- 146 N Merrill Rd Unit 64
- 146 N Merrill Rd Unit 71
- 146 N Merrill Rd Unit 165
- 146 N Merrill Rd Unit 21
- 146 N Merrill Rd Unit 20
- 146 N Merrill Rd Unit 2
- 146 N Merrill Rd Unit 85
- 146 N Merrill Rd Unit 146
- 146 N Merrill Rd Unit 107
- 146 N Merrill Rd Unit 73
- 146 N Merrill Rd Unit 90
- 146 N Merrill Rd Unit 68
- 146 N Merrill Rd Unit 155
- 10411 E 1st St
- 226 N 103rd Cir
- 10223 E Billings St
- 10220 E Apache Trail Unit 52
- 10220 E Apache Trail Unit 217
- 10220 E Apache Trail Unit 213
- 10410 E Albany St
- 10358 E Albany St
- 10401 E Boise St
- 10403 E Boise St
- 10357 E Boise St
- 10401 E Albany St
- 10418 E Albany St
- 10409 E Albany St
- 10357 E Albany St
- 10348 E Albany St
- 10417 E Boise St
- 10347 E Boise St
- 10417 E Albany St
- 10347 E Albany St
- 10402 E Akron St
- 10426 E Albany St
- 10414 E Akron St
- 10358 E Akron St
- 10402 E Boise St
- 10425 E Boise St
Your Personal Tour Guide
Ask me questions while you tour the home.