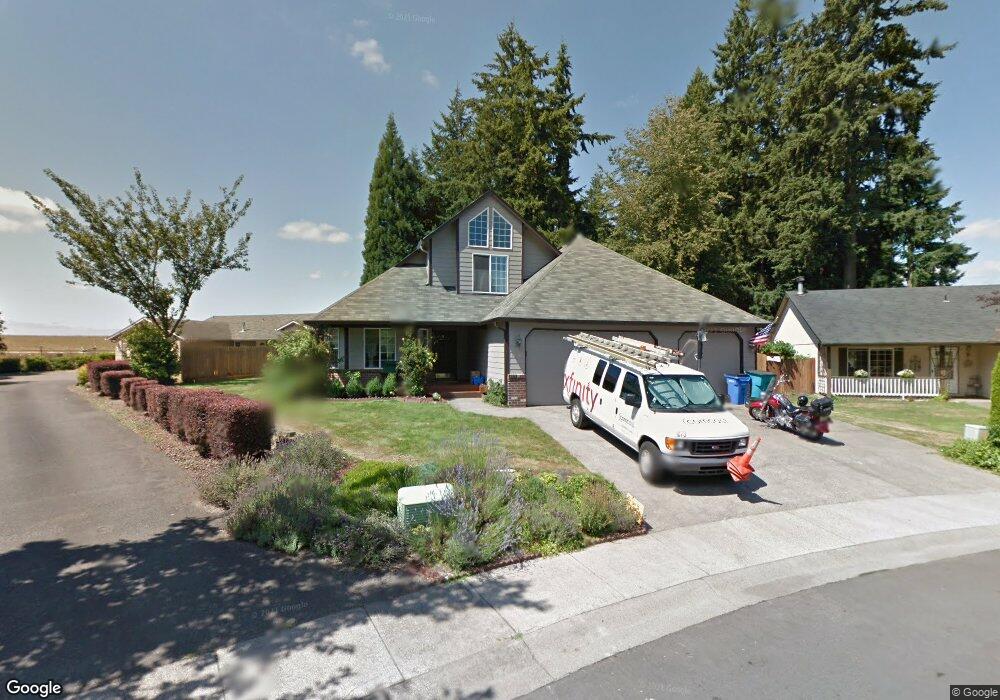
10404 NE 90th St Vancouver, WA 98662
Orchards Area NeighborhoodEstimated Value: $618,000 - $696,000
4
Beds
3
Baths
2,539
Sq Ft
$259/Sq Ft
Est. Value
About This Home
This home is located at 10404 NE 90th St, Vancouver, WA 98662 and is currently estimated at $657,004, approximately $258 per square foot. 10404 NE 90th St is a home located in Clark County with nearby schools including Silver Star Elementary School, Covington Middle School, and Heritage High School.
Ownership History
Date
Name
Owned For
Owner Type
Purchase Details
Closed on
Jan 5, 2017
Sold by
Tilton Robert and Tilton Magda
Bought by
Hull Jacob and Hull Jamie
Current Estimated Value
Home Financials for this Owner
Home Financials are based on the most recent Mortgage that was taken out on this home.
Original Mortgage
$297,000
Outstanding Balance
$244,475
Interest Rate
4.08%
Mortgage Type
New Conventional
Estimated Equity
$412,529
Purchase Details
Closed on
Jul 19, 2012
Sold by
Keller Michael E and Keller Annette M
Bought by
Tilton Robert
Home Financials for this Owner
Home Financials are based on the most recent Mortgage that was taken out on this home.
Original Mortgage
$265,109
Interest Rate
3.5%
Mortgage Type
FHA
Purchase Details
Closed on
Jun 29, 1998
Sold by
Bunch Terry C
Bought by
Keller Michael E and Keller Annette M
Create a Home Valuation Report for This Property
The Home Valuation Report is an in-depth analysis detailing your home's value as well as a comparison with similar homes in the area
Home Values in the Area
Average Home Value in this Area
Purchase History
| Date | Buyer | Sale Price | Title Company |
|---|---|---|---|
| Hull Jacob | $660,280 | Chicago Title | |
| Tilton Robert | $270,000 | First American Title | |
| Keller Michael E | -- | Charter Title Corporation |
Source: Public Records
Mortgage History
| Date | Status | Borrower | Loan Amount |
|---|---|---|---|
| Open | Hull Jacob | $297,000 | |
| Previous Owner | Tilton Robert | $265,109 |
Source: Public Records
Tax History Compared to Growth
Tax History
| Year | Tax Paid | Tax Assessment Tax Assessment Total Assessment is a certain percentage of the fair market value that is determined by local assessors to be the total taxable value of land and additions on the property. | Land | Improvement |
|---|---|---|---|---|
| 2025 | $5,892 | $599,721 | $184,800 | $414,921 |
| 2024 | $5,636 | $583,878 | $184,800 | $399,078 |
| 2023 | $5,592 | $585,131 | $184,800 | $400,331 |
| 2022 | $5,162 | $571,738 | $184,800 | $386,938 |
| 2021 | $4,929 | $491,629 | $156,800 | $334,829 |
| 2020 | $4,628 | $441,681 | $140,000 | $301,681 |
| 2019 | $4,196 | $416,299 | $135,850 | $280,449 |
| 2018 | $4,680 | $407,485 | $0 | $0 |
| 2017 | $4,124 | $367,121 | $0 | $0 |
| 2016 | $3,841 | $337,281 | $0 | $0 |
| 2015 | $3,918 | $292,493 | $0 | $0 |
| 2014 | -- | $284,334 | $0 | $0 |
| 2013 | -- | $247,746 | $0 | $0 |
Source: Public Records
Map
Nearby Homes
- 10507 NE 90th St
- 9411 NE 106th Ct
- 8406 NE 105th Ave
- 8520 NE 111th Ave
- 10913 NE 85th St
- 9701 NE 108th Ct
- 11309 NE Conifer Dr
- 11215 NE 85th Cir
- 9604 NE 83rd Cir
- 7817 NE 107th Ave
- 11000 NE 101st St
- 10006 NE 103rd St
- 9011 NE 89th Cir
- 9006 NE 89th Cir
- 9217 NE 81st Loop
- 10501 NE 109th Ct
- 9714 NE 91st Ave
- 10315 NE 107th St
- 10414 NE 95th Ave
- 10317 NE 116th Place
- 10402 NE 90th St
- 10408 NE 90th St
- 0 NE 90th St Unit 649737
- 0 NE 90th St Unit 646272
- 0 NE 90th St Unit 647977
- 1440 NE 90th St
- 8918 NE 104th Ave
- 10401 NE 92nd St
- 10412 NE 90th St
- 8914 NE 104th Ave
- 10409 NE 92nd St
- 10413 NE 90th St
- 8910 NE 104th Ave
- 10416 NE 90th St
- 10406 NE 89th St
- 10415 NE 92nd St
- 8906 NE 104th Ave
- 10312 NE 92nd St
- 10501 NE 90th St
- 10410 NE 89th St