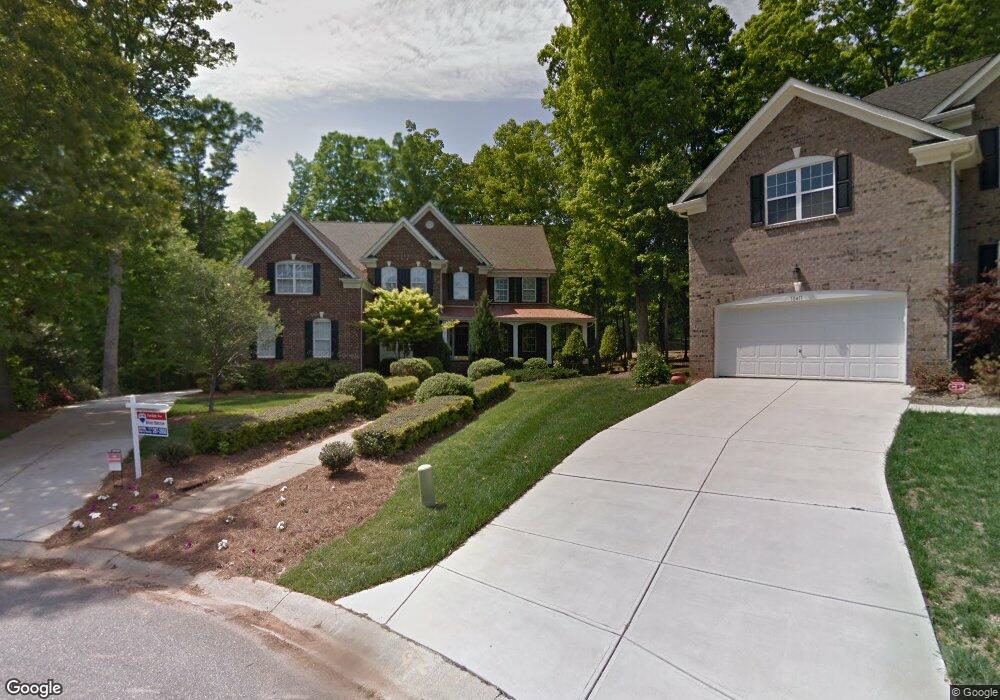
10405 Old Brassle Dr Unit 311 Mint Hill, NC 28227
Estimated Value: $874,000 - $986,000
4
Beds
5
Baths
4,400
Sq Ft
$212/Sq Ft
Est. Value
About This Home
This home is located at 10405 Old Brassle Dr Unit 311, Mint Hill, NC 28227 and is currently estimated at $931,038, approximately $211 per square foot. 10405 Old Brassle Dr Unit 311 is a home located in Mecklenburg County with nearby schools including Bain Elementary, Mint Hill Middle School, and Independence High.
Ownership History
Date
Name
Owned For
Owner Type
Purchase Details
Closed on
Aug 16, 2016
Sold by
Parker And Orleans Home Builders Inc
Bought by
Varner Jesse J and Varner Kerry M
Current Estimated Value
Purchase Details
Closed on
Sep 28, 2015
Sold by
Union Bank And Trust and Blosser George E
Bought by
Varner Jesse J and Varner Kerry M
Home Financials for this Owner
Home Financials are based on the most recent Mortgage that was taken out on this home.
Original Mortgage
$349,600
Interest Rate
3.97%
Mortgage Type
New Conventional
Purchase Details
Closed on
Apr 16, 2008
Sold by
Parker & Orleans Homebuilders Inc
Bought by
First National Bank and George F Blosser Ira
Purchase Details
Closed on
May 6, 2003
Sold by
Olde Sycamore Llc
Bought by
Parker & Orleans Homebuilders Inc
Create a Home Valuation Report for This Property
The Home Valuation Report is an in-depth analysis detailing your home's value as well as a comparison with similar homes in the area
Home Values in the Area
Average Home Value in this Area
Purchase History
| Date | Buyer | Sale Price | Title Company |
|---|---|---|---|
| Varner Jesse J | -- | None Available | |
| Varner Jesse J | $437,000 | None Available | |
| First National Bank | $535,000 | None Available | |
| Parker & Orleans Homebuilders Inc | $55,000 | -- |
Source: Public Records
Mortgage History
| Date | Status | Borrower | Loan Amount |
|---|---|---|---|
| Previous Owner | Varner Jesse J | $349,600 |
Source: Public Records
Tax History Compared to Growth
Tax History
| Year | Tax Paid | Tax Assessment Tax Assessment Total Assessment is a certain percentage of the fair market value that is determined by local assessors to be the total taxable value of land and additions on the property. | Land | Improvement |
|---|---|---|---|---|
| 2025 | -- | $701,600 | $112,500 | $589,100 |
| 2024 | -- | $701,600 | $112,500 | $589,100 |
| 2023 | $4,849 | $688,200 | $112,500 | $575,700 |
| 2022 | $4,341 | $493,400 | $72,000 | $421,400 |
| 2021 | $4,341 | $493,400 | $72,000 | $421,400 |
| 2020 | $4,716 | $536,400 | $72,000 | $464,400 |
| 2019 | $4,710 | $536,400 | $72,000 | $464,400 |
| 2018 | $5,354 | $487,200 | $54,000 | $433,200 |
| 2017 | $5,314 | $487,200 | $54,000 | $433,200 |
| 2016 | $5,310 | $487,200 | $54,000 | $433,200 |
| 2015 | $5,307 | $487,200 | $54,000 | $433,200 |
| 2014 | $5,305 | $487,200 | $54,000 | $433,200 |
Source: Public Records
Map
Nearby Homes
- 7511 Olde Sycamore Dr
- 10317 Clubhouse View Ln
- 7909 Plantation Falls Ln
- 8102 Rolling Fields Rd
- 10110 Whispering Falls Ave
- 17014 Malone Ln
- 17034 Malone Ln
- 17041 Malone Ln
- 1875 Rock Hill Church Rd Unit 4
- 1865 Rock Hill Church Rd Unit 3
- 000 N Carolina 218
- 10602 Persimmon Creek Dr
- 6809 Old Persimmon Dr
- 7918 Silver Maple Ln
- 11118 Persimmon Creek Dr
- 11024 Persimmon Creek Dr
- 7922 Silver Maple Ln
- 1618 Ballwood Ct
- 1940 Rock Hill Church Rd
- 9113 Brief Rd
- 10405 Old Brassle Dr
- 10411 Old Brassle Dr
- 10400 Old Brassle Dr
- 10406 Old Brassle Dr
- 7831 Olde Sycamore Dr
- 10412 Old Brassle Dr
- 10501 Old Brassle Dr
- 7809 Scottsburg Ct
- 10500 Old Brassle Dr Unit 22
- 10500 Old Brassle Dr
- 10511 Old Brassle Dr
- 10506 Old Brassle Dr
- 10514 Old Brassle Dr
- 7814 Scottsburg Ct
- 10524 Old Brassle Dr
- 7806 Scottsburg Ct
- 7810 Scottsburg Ct
- 7810 Scottsburg Ct Unit 11
- 10503 Sycamore Club Dr
- 10532 Old Brassle Dr