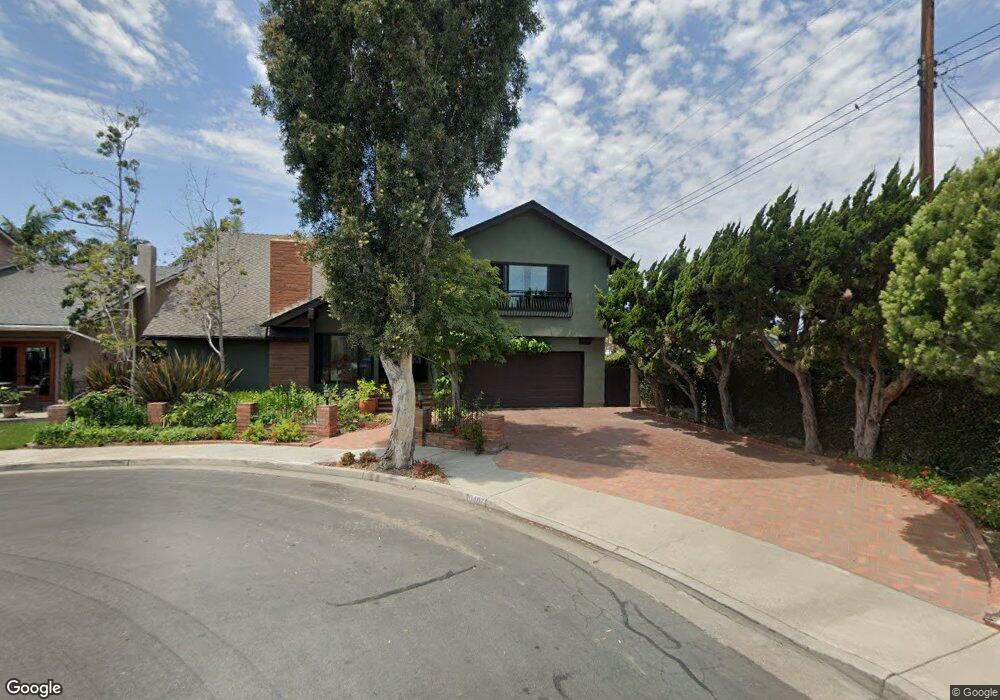
10407 Santa Clara St Cypress, CA 90630
Estimated Value: $996,000 - $1,364,408
5
Beds
3
Baths
2,750
Sq Ft
$450/Sq Ft
Est. Value
About This Home
This home is located at 10407 Santa Clara St, Cypress, CA 90630 and is currently estimated at $1,236,852, approximately $449 per square foot. 10407 Santa Clara St is a home located in Orange County with nearby schools including Los Alamitos Elementary School, Jack L. Weaver Elementary School, and Sharon Christa Mcauliffe Middle School.
Ownership History
Date
Name
Owned For
Owner Type
Purchase Details
Closed on
Apr 16, 2012
Sold by
Summers Duane K and Summers Cheri A
Bought by
Summers Duane K and Summers Cheri A
Current Estimated Value
Home Financials for this Owner
Home Financials are based on the most recent Mortgage that was taken out on this home.
Original Mortgage
$218,500
Outstanding Balance
$29,443
Interest Rate
3.85%
Mortgage Type
New Conventional
Estimated Equity
$1,207,409
Purchase Details
Closed on
Feb 23, 2006
Sold by
Summers Duane K and Summers Cheri A
Bought by
Summers Duane K and Summers Cheri A
Purchase Details
Closed on
Jan 8, 2002
Sold by
Baxter Leslie W and Baxter Lillie M
Bought by
Summers Duane and Summers Cheri
Home Financials for this Owner
Home Financials are based on the most recent Mortgage that was taken out on this home.
Original Mortgage
$255,000
Interest Rate
7.15%
Create a Home Valuation Report for This Property
The Home Valuation Report is an in-depth analysis detailing your home's value as well as a comparison with similar homes in the area
Home Values in the Area
Average Home Value in this Area
Purchase History
| Date | Buyer | Sale Price | Title Company |
|---|---|---|---|
| Summers Duane K | -- | Lawyers Title | |
| Summers Duane K | -- | Lawyers Title | |
| Summers Duane K | -- | None Available | |
| Summers Duane K | -- | None Available | |
| Summers Duane | $420,000 | Chicago Title Co |
Source: Public Records
Mortgage History
| Date | Status | Borrower | Loan Amount |
|---|---|---|---|
| Open | Summers Duane K | $218,500 | |
| Closed | Summers Duane | $255,000 |
Source: Public Records
Tax History Compared to Growth
Tax History
| Year | Tax Paid | Tax Assessment Tax Assessment Total Assessment is a certain percentage of the fair market value that is determined by local assessors to be the total taxable value of land and additions on the property. | Land | Improvement |
|---|---|---|---|---|
| 2025 | $7,390 | $657,390 | $463,581 | $193,809 |
| 2024 | $7,390 | $644,500 | $454,491 | $190,009 |
| 2023 | $7,223 | $631,863 | $445,579 | $186,284 |
| 2022 | $7,141 | $619,474 | $436,842 | $182,632 |
| 2021 | $7,048 | $607,328 | $428,277 | $179,051 |
| 2020 | $7,021 | $601,101 | $423,885 | $177,216 |
| 2019 | $6,823 | $589,315 | $415,573 | $173,742 |
| 2018 | $6,731 | $577,760 | $407,424 | $170,336 |
| 2017 | $6,499 | $566,432 | $399,435 | $166,997 |
| 2016 | $6,446 | $555,326 | $391,603 | $163,723 |
| 2015 | $6,401 | $546,985 | $385,721 | $161,264 |
| 2014 | $6,059 | $536,271 | $378,165 | $158,106 |
Source: Public Records
Map
Nearby Homes
- 10458 Santa Clara St
- 4286 Dina Ct
- 10415 Carlyle Ct
- 4005 Bryant Ct
- 4418 Larwin Ave
- 4481 Larwin Ave
- 3652 San Joaquin Ave
- 3832 Holden Cir
- 3862 Toland Ave
- 4777 Larwin Ave
- 4223 Paseo de Plata
- 4635 Luna Ct
- 9674 Paseo de Oro
- 9676 Bloomfield St
- 4644 Portofino Cir
- 3540 Kemble Ave
- 8381 E Blithedale St
- 5041 Myra Ave
- 4068 Avenida Sevilla
- 3260 Lilly Ave
- 10417 Santa Clara St
- 4262 Marion Ave
- 4252 Marion Ave
- 10406 Santa Marta St
- 4272 Marion Ave
- 10416 Santa Marta St
- 10427 Santa Clara St
- 4242 Marion Ave
- 10408 Santa Clara St
- 10426 Santa Marta St
- 10418 Santa Clara St
- 4282 Marion Ave
- 4232 Marion Ave
- 10437 Santa Clara St
- 10428 Santa Clara St
- 10436 Santa Marta St
- 4292 Marion Ave
- 10282 Delano Dr
- 10438 Santa Clara St
- 4222 Marion Ave