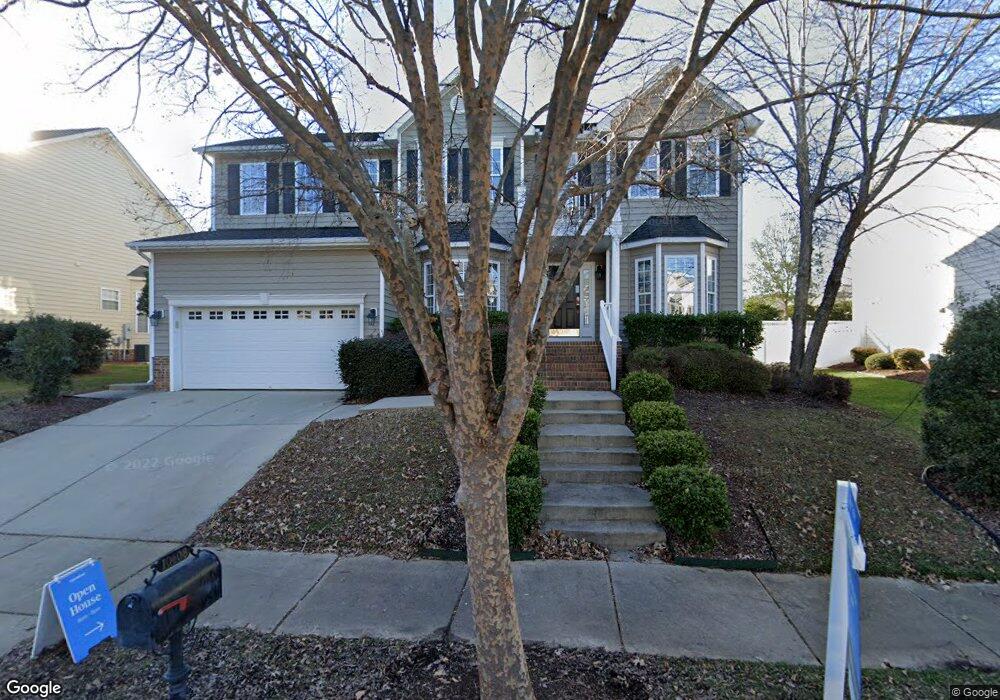
10408 Chandler Way Raleigh, NC 27614
Bedford at Falls River NeighborhoodEstimated Value: $642,000 - $739,000
4
Beds
3
Baths
3,133
Sq Ft
$225/Sq Ft
Est. Value
About This Home
This home is located at 10408 Chandler Way, Raleigh, NC 27614 and is currently estimated at $704,934, approximately $225 per square foot. 10408 Chandler Way is a home located in Wake County with nearby schools including Abbotts Creek Elementary School, Wakefield Middle, and Wakefield High School.
Ownership History
Date
Name
Owned For
Owner Type
Purchase Details
Closed on
May 2, 2019
Sold by
Opendoor Property W31 Llc
Bought by
Vivenzio Daniel G and Vivenzio Colleen M
Current Estimated Value
Home Financials for this Owner
Home Financials are based on the most recent Mortgage that was taken out on this home.
Original Mortgage
$342,000
Outstanding Balance
$300,687
Interest Rate
4.2%
Mortgage Type
New Conventional
Estimated Equity
$404,247
Purchase Details
Closed on
Jul 12, 2018
Sold by
Maye Reginald W and Maye Felicia Carlton
Bought by
Opendoor Property W31 Llc
Purchase Details
Closed on
Nov 9, 2015
Sold by
Carlton Mayes Felicia and Maye Reginald
Bought by
Mayes Reginald and Carlton Maye Felcia
Purchase Details
Closed on
Dec 17, 2003
Sold by
Brandywine Llc
Bought by
The New Fortis Corp
Create a Home Valuation Report for This Property
The Home Valuation Report is an in-depth analysis detailing your home's value as well as a comparison with similar homes in the area
Home Values in the Area
Average Home Value in this Area
Purchase History
| Date | Buyer | Sale Price | Title Company |
|---|---|---|---|
| Vivenzio Daniel G | $360,000 | None Available | |
| Opendoor Property W31 Llc | $386,000 | None Available | |
| Mayes Reginald | -- | None Available | |
| The New Fortis Corp | $711,500 | -- |
Source: Public Records
Mortgage History
| Date | Status | Borrower | Loan Amount |
|---|---|---|---|
| Open | Vivenzio Daniel G | $342,000 |
Source: Public Records
Tax History Compared to Growth
Tax History
| Year | Tax Paid | Tax Assessment Tax Assessment Total Assessment is a certain percentage of the fair market value that is determined by local assessors to be the total taxable value of land and additions on the property. | Land | Improvement |
|---|---|---|---|---|
| 2025 | $5,966 | $681,763 | $155,000 | $526,763 |
| 2024 | $5,941 | $681,763 | $155,000 | $526,763 |
| 2023 | $4,148 | $378,728 | $80,000 | $298,728 |
| 2022 | $3,855 | $378,728 | $80,000 | $298,728 |
| 2021 | $3,705 | $378,728 | $80,000 | $298,728 |
| 2020 | $3,638 | $378,728 | $80,000 | $298,728 |
| 2019 | $4,445 | $381,803 | $110,000 | $271,803 |
| 2018 | $0 | $381,803 | $110,000 | $271,803 |
| 2017 | $3,992 | $381,803 | $110,000 | $271,803 |
| 2016 | $3,910 | $391,803 | $120,000 | $271,803 |
| 2015 | $3,931 | $377,728 | $104,000 | $273,728 |
| 2014 | $3,729 | $377,728 | $104,000 | $273,728 |
Source: Public Records
Map
Nearby Homes
- 2728 Cloud Mist Cir
- 2740 Cloud Mist Cir
- 3436 Falls River Ave
- 2704 Snowy Meadow Ct
- 3428 van Hessen Dr
- 3405 van Hessen Dr
- 10638 Cardington Ln
- 10603 Friendly Neighbor Ln
- 2408 Gerber Ct
- 3606 Silver Forrest Ln
- 2822 Winter Song Rd
- 2419 Rogerson St
- 2231 Cloud Cover
- 3123 Winding Waters Way
- 10714 Bedfordtown Dr
- 10701 Royal Forrest Dr
- 2106 Cloud Cover
- 10507 Bedfordtown Dr
- 3110 Settle In Ln
- 2220 Raven Rd Unit 104
- 10412 Chandler Way
- 10404 Chandler Way
- 2716 Cloud Mist Cir
- 2714 Cloud Mist Cir
- 10416 Chandler Way
- 2718 Cloud Mist Cir
- 2712 Cloud Mist Cir
- 2720 Cloud Mist Cir
- 10400 Chandler Way
- 10405 Chandler Way
- 10411 Chandler Way
- 2724 Cloud Mist Cir
- 2709 Cloud Mist Cir
- 2726 Cloud Mist Cir
- 2707 Cloud Mist Cir
- 10415 Chandler Way
- 2705 Cloud Mist Cir
- 2730 Cloud Mist Cir
- 10420 Chandler Way
- 2703 Cloud Mist Cir