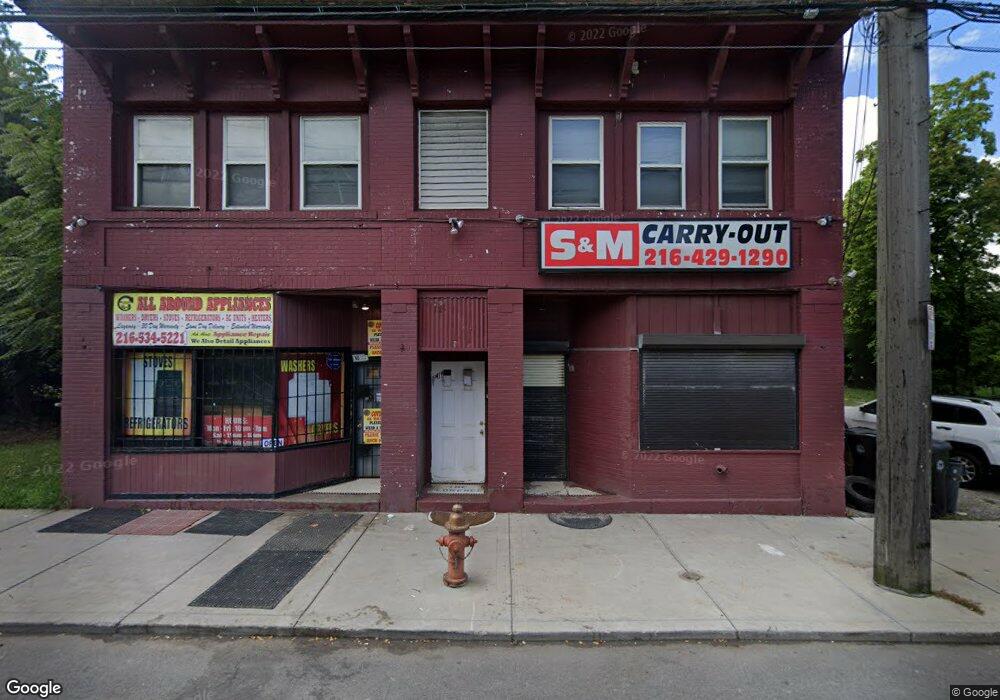
10408 Union Ave Cleveland, OH 44105
Union-Miles Park NeighborhoodEstimated Value: $147,283
--
Bed
2
Baths
4,848
Sq Ft
$30/Sq Ft
Est. Value
About This Home
This home is located at 10408 Union Ave, Cleveland, OH 44105 and is currently priced at $147,283, approximately $30 per square foot. 10408 Union Ave is a home located in Cuyahoga County with nearby schools including Andrew J. Rickoff School, Anton Grdina School, and Bolton.
Ownership History
Date
Name
Owned For
Owner Type
Purchase Details
Closed on
Jul 5, 2024
Sold by
Robert M Brown Revocable Living Trust and Brown Robert M
Bought by
Wulu Aaron B
Current Estimated Value
Home Financials for this Owner
Home Financials are based on the most recent Mortgage that was taken out on this home.
Original Mortgage
$92,500
Outstanding Balance
$91,385
Interest Rate
6.94%
Mortgage Type
New Conventional
Purchase Details
Closed on
Oct 27, 2020
Sold by
Starks Shawn M
Bought by
Brown Robert M and Brown Robert M
Purchase Details
Closed on
Dec 31, 2015
Sold by
Starks Milton
Bought by
Starks Shawn M
Purchase Details
Closed on
Aug 5, 2004
Sold by
Johnson Robert C and Johnson Natalie L
Bought by
Starks Milton
Purchase Details
Closed on
Jul 6, 1999
Sold by
Pugh Bessie J
Bought by
Johnson Robert C and Johnson Aaron
Purchase Details
Closed on
Oct 9, 1984
Sold by
Jackson Arthur R
Bought by
Baltimore Della
Purchase Details
Closed on
Jan 1, 1975
Bought by
Jackson Arthur R
Create a Home Valuation Report for This Property
The Home Valuation Report is an in-depth analysis detailing your home's value as well as a comparison with similar homes in the area
Home Values in the Area
Average Home Value in this Area
Purchase History
| Date | Buyer | Sale Price | Title Company |
|---|---|---|---|
| Wulu Aaron B | $102,500 | None Listed On Document | |
| Brown Robert M | $70,000 | Titleco Title Agency Ltd | |
| Starks Shawn M | -- | None Available | |
| Starks Milton | $25,000 | Real Living Title Agency L | |
| Johnson Robert C | $25,000 | Gateway Title Agency Inc | |
| Baltimore Della | -- | -- | |
| Jackson Arthur R | -- | -- |
Source: Public Records
Mortgage History
| Date | Status | Borrower | Loan Amount |
|---|---|---|---|
| Open | Wulu Aaron B | $92,500 |
Source: Public Records
Tax History Compared to Growth
Tax History
| Year | Tax Paid | Tax Assessment Tax Assessment Total Assessment is a certain percentage of the fair market value that is determined by local assessors to be the total taxable value of land and additions on the property. | Land | Improvement |
|---|---|---|---|---|
| 2024 | $2,392 | $23,170 | $2,695 | $20,475 |
| 2023 | $2,802 | $21,850 | $2,980 | $18,870 |
| 2022 | $2,179 | $21,840 | $2,975 | $18,865 |
| 2021 | $2,186 | $21,840 | $2,980 | $18,870 |
| 2020 | $1,427 | $13,720 | $2,700 | $11,030 |
| 2019 | $1,344 | $39,200 | $7,700 | $31,500 |
| 2018 | $1,310 | $13,720 | $2,700 | $11,030 |
| 2017 | $1,191 | $11,730 | $2,490 | $9,240 |
| 2016 | $1,192 | $11,730 | $2,490 | $9,240 |
| 2015 | $1,484 | $11,730 | $2,490 | $9,240 |
| 2014 | $1,484 | $14,670 | $3,120 | $11,550 |
Source: Public Records
Map
Nearby Homes
- 3546 E 104th St
- 3559 E 105th St
- 10201 Gibson Ave
- 3561 E 106th St
- 3575 E 105th St
- 10111 Gibson Ave
- 3535 E 108th St
- 3566 E 108th St
- 3452 E 104th St
- 3637 E 105th St
- 3398 E 103rd St
- 3641 E 104th St
- 3410 E 110th St
- 3406 E 110th St
- 3659 E 104th St
- 3665 E 103rd St
- 9919 Raymond Ave
- 3445 Martin Luther King jr Dr
- 10008 Aetna Rd
- 3389 Martin Luther King jr Dr
- 10404 Union Ave
- 3512 E 105th St
- 3511 E 104th St
- 3516 E 105th St
- 3515 E 104th St
- 3520 E 105th St
- 3519 E 104th St
- 3524 E 105th St
- 3523 E 104th St
- 3517 E 105th St
- 3526 E 105th St
- 3521 E 105th St
- 3512 E 104th St
- 3516 E 104th St
- 3527 E 104th St
- 10512 Union Ave
- 3520 E 104th St
- 3523 E 105th St
- 3530 E 105th St
- 3531 E 104th St