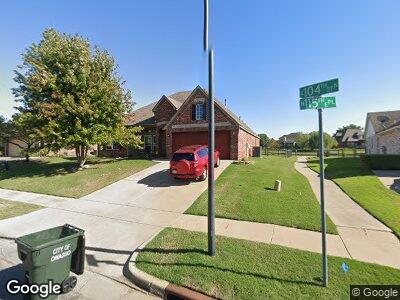
10409 N 115th East Place Owasso, OK 74055
Estimated Value: $326,000 - $356,000
--
Bed
2
Baths
2,095
Sq Ft
$162/Sq Ft
Est. Value
About This Home
This home is located at 10409 N 115th East Place, Owasso, OK 74055 and is currently estimated at $338,612, approximately $161 per square foot. 10409 N 115th East Place is a home located in Tulsa County with nearby schools including Larkin Bailey Elementary School, Owasso 6th Grade Center, and Owasso 7th Grade Center.
Ownership History
Date
Name
Owned For
Owner Type
Purchase Details
Closed on
Aug 15, 2024
Sold by
Chea Jeremy and Mcallister Brenna
Bought by
Jeremy Chea And Brenna Mcallister Revocable L and Chea
Current Estimated Value
Purchase Details
Closed on
Apr 23, 2024
Sold by
Chea Jeremy D
Bought by
Graddy Glenda
Purchase Details
Closed on
Apr 27, 2007
Sold by
Zubin Armando and Zubin Maria L
Bought by
Chea Jeremy D and Chea Amanda L
Home Financials for this Owner
Home Financials are based on the most recent Mortgage that was taken out on this home.
Original Mortgage
$189,900
Interest Rate
6.13%
Mortgage Type
VA
Purchase Details
Closed on
Sep 26, 2003
Sold by
Stanford Homes Llc
Bought by
Zubin Armando
Purchase Details
Closed on
May 23, 2003
Sold by
Bailey Ranch Investment Group Llc
Bought by
Stanford Homes Llc
Create a Home Valuation Report for This Property
The Home Valuation Report is an in-depth analysis detailing your home's value as well as a comparison with similar homes in the area
Home Values in the Area
Average Home Value in this Area
Purchase History
| Date | Buyer | Sale Price | Title Company |
|---|---|---|---|
| Jeremy Chea And Brenna Mcallister Revocable L | -- | None Listed On Document | |
| Graddy Glenda | $340,000 | Apex Title & Closing Services | |
| Chea Jeremy D | -- | Apex Title & Closing Services | |
| Chea Jeremy D | $190,000 | None Available | |
| Zubin Armando | $176,000 | -- | |
| Stanford Homes Llc | $25,500 | -- |
Source: Public Records
Mortgage History
| Date | Status | Borrower | Loan Amount |
|---|---|---|---|
| Previous Owner | Chea Jeremy D | $193,245 | |
| Previous Owner | Chea Jeremy D | $189,900 |
Source: Public Records
Tax History Compared to Growth
Tax History
| Year | Tax Paid | Tax Assessment Tax Assessment Total Assessment is a certain percentage of the fair market value that is determined by local assessors to be the total taxable value of land and additions on the property. | Land | Improvement |
|---|---|---|---|---|
| 2024 | $2,459 | $23,727 | $2,296 | $21,431 |
| 2023 | $2,459 | $22,597 | $2,278 | $20,319 |
| 2022 | $2,446 | $21,522 | $2,603 | $18,919 |
| 2021 | $2,306 | $20,497 | $3,135 | $17,362 |
| 2020 | $2,306 | $20,497 | $3,135 | $17,362 |
| 2019 | $2,296 | $20,497 | $3,135 | $17,362 |
| 2018 | $2,224 | $20,497 | $3,135 | $17,362 |
| 2017 | $2,231 | $20,497 | $3,135 | $17,362 |
| 2016 | $2,240 | $20,497 | $3,135 | $17,362 |
| 2015 | $2,256 | $20,497 | $3,135 | $17,362 |
| 2014 | $2,277 | $20,497 | $3,135 | $17,362 |
Source: Public Records
Map
Nearby Homes
- 10401 N 117th Ave E
- 10636 N Garnett Rd
- 10010 N Garnett Rd
- 10209 N 119th Ave E
- 110 103rd St N
- 11624 E 106th St N
- 0 103rd St N Unit 2428548
- 11923 E 105th Ct N
- 11850 E 106th St N
- 9909 N 119th Ave E
- 11414 E 99th St N
- 9404 N 115th Ave E
- 10602 N 120th Ct E
- 10020 N 110th Ave E
- 12026 E 106th Place N
- 11906 E 99th St N
- 10805 E 99th Place N
- 10802 E 101st St N
- 10804 E 100th St N
- 11704 E 109th St N
- 10409 N 115th East Place
- 10409 N 115th Place E
- 10411 N 115th East Place
- 11508 E 104th St N
- 10413 N 115th East Place
- 11506 E 104th St N
- 10410 N 115th East Place
- 11505 E 104th St N
- 10412 N 115th East Place
- 11506 E 105th St N
- 11504 E 104th St N
- 10402 N 116th East Ave
- 10400 N 116th East Ave
- 10404 N 116th East Ave
- 10414 N 115th East Place
- 11503 E 104th St N
- 11508 E 105th St N
- 11502 E 104th St N
- 11509 E 103rd St N
- 10306 N 116th East Ct