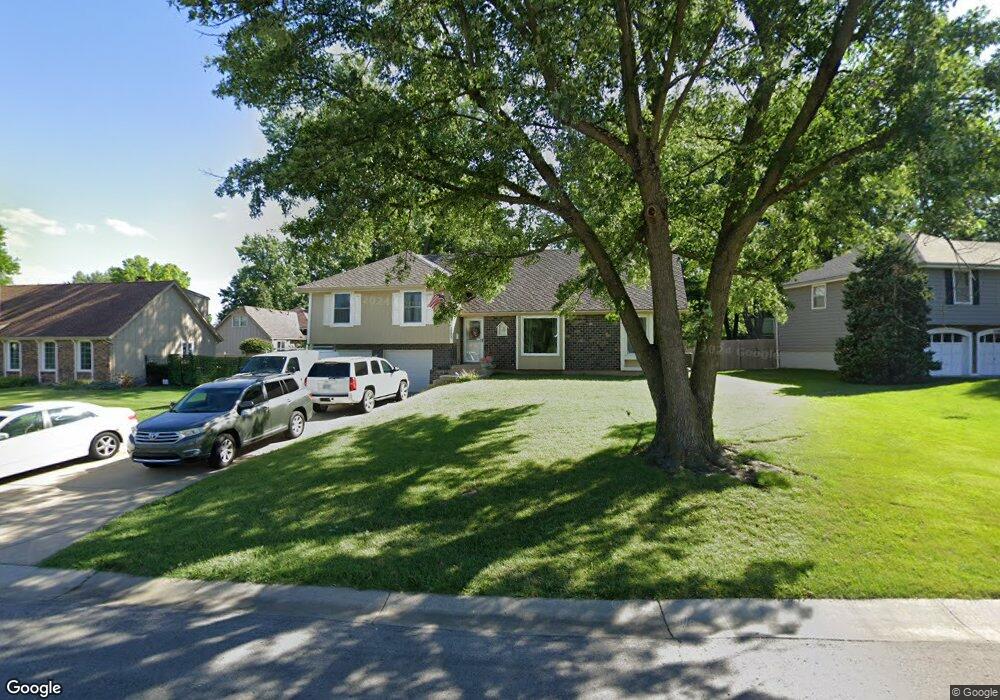
10409 W 53rd St Shawnee, KS 66203
Estimated Value: $365,000 - $412,000
4
Beds
2
Baths
1,731
Sq Ft
$224/Sq Ft
Est. Value
About This Home
This home is located at 10409 W 53rd St, Shawnee, KS 66203 and is currently estimated at $387,000, approximately $223 per square foot. 10409 W 53rd St is a home located in Johnson County with nearby schools including Bluejacket / Flint Elementary, Hocker Grove Middle School, and Shawnee Mission North High School.
Ownership History
Date
Name
Owned For
Owner Type
Purchase Details
Closed on
Nov 20, 2017
Sold by
Hay H R and H R Ray Trust
Bought by
Hills Wendy J and Wendy J Hills Trust
Current Estimated Value
Home Financials for this Owner
Home Financials are based on the most recent Mortgage that was taken out on this home.
Original Mortgage
$126,000
Outstanding Balance
$68,748
Interest Rate
3.94%
Mortgage Type
New Conventional
Estimated Equity
$318,252
Purchase Details
Closed on
Feb 6, 2003
Sold by
Dearinger Earl W and Dearinger Janice H
Bought by
Davey Greg and Davey Marsha
Home Financials for this Owner
Home Financials are based on the most recent Mortgage that was taken out on this home.
Original Mortgage
$163,400
Interest Rate
5.84%
Purchase Details
Closed on
Nov 21, 2001
Sold by
Sells Bobby J and Sells Norma J
Bought by
Dearinger Earl W and Dearinger Janice H
Create a Home Valuation Report for This Property
The Home Valuation Report is an in-depth analysis detailing your home's value as well as a comparison with similar homes in the area
Home Values in the Area
Average Home Value in this Area
Purchase History
| Date | Buyer | Sale Price | Title Company |
|---|---|---|---|
| Hills Wendy J | -- | Brokers Title Llc | |
| Davey Greg | -- | Chicago Title Insurance Co | |
| Dearinger Earl W | -- | Columbian National Title Ins |
Source: Public Records
Mortgage History
| Date | Status | Borrower | Loan Amount |
|---|---|---|---|
| Open | Hills Wendy J | $126,000 | |
| Previous Owner | Davey Greg | $163,400 |
Source: Public Records
Tax History Compared to Growth
Tax History
| Year | Tax Paid | Tax Assessment Tax Assessment Total Assessment is a certain percentage of the fair market value that is determined by local assessors to be the total taxable value of land and additions on the property. | Land | Improvement |
|---|---|---|---|---|
| 2024 | $3,970 | $37,571 | $7,673 | $29,898 |
| 2023 | $4,091 | $38,157 | $6,974 | $31,183 |
| 2022 | $3,481 | $32,373 | $6,340 | $26,033 |
| 2021 | $3,323 | $28,957 | $5,511 | $23,446 |
| 2020 | $3,085 | $26,519 | $5,007 | $21,512 |
| 2019 | $3,030 | $26,036 | $4,775 | $21,261 |
| 2018 | $3,151 | $26,979 | $4,775 | $22,204 |
| 2017 | $2,993 | $25,220 | $4,337 | $20,883 |
| 2016 | $2,883 | $23,978 | $4,337 | $19,641 |
| 2015 | $2,586 | $22,345 | $4,337 | $18,008 |
| 2013 | -- | $21,988 | $4,337 | $17,651 |
Source: Public Records
Map
Nearby Homes
- Ashwood Plan at Bristol Highlands - North
- The Fleetwood Plan at Bristol Highlands - The Villas
- Cypress II Plan at Bristol Highlands - North
- The Fleetwood Plan at Bristol Highlands - The Manors
- The Brentwood Plan at Bristol Highlands - The Villas
- Yorkshire V Plan at Bristol Highlands - North
- The Kirkwood Plan at Bristol Highlands - The Villas
- 8013 Payne St
- The Rockwood Plan at Bristol Highlands - The Villas
- Magnolia Plan at Bristol Highlands - North
- 10116 W 52nd Terrace
- 11002 W 55th Terrace
- 9929 W 52nd St
- 5308 Mcanany Dr
- 10511 W 49th Place
- 9719 W 53rd St
- 11403 W 51st Terrace
- 0 W 49th St
- 5220 Hayes St
- 5003 Knox Ave
- 10415 W 53rd St
- 10403 W 53rd St
- 5332 Queal Dr
- 10505 W 53rd St
- 5336 Queal Dr
- 5321 Larsen Ln
- 10408 W 53rd St
- 10400 W 53rd St
- 5400 Queal Dr
- 10511 W 53rd St
- 10412 W 53rd St
- 5325 Larsen Ln
- 10500 W 53rd St
- 5329 Queal Dr
- 10506 W 53rd St
- 5325 Queal Dr
- 5333 Queal Dr
- 5316 Queal Dr
- 5406 Queal Dr
- 5320 Larsen Ln