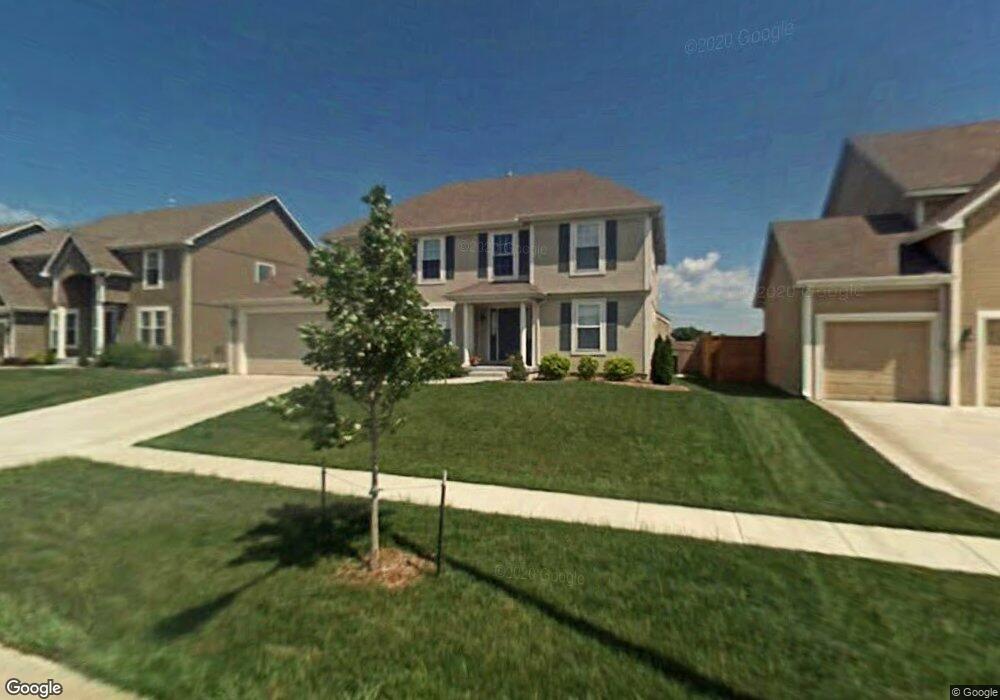
1041 Allyssa Ct Lansing, KS 66043
Estimated Value: $380,000 - $408,000
4
Beds
3
Baths
2,546
Sq Ft
$156/Sq Ft
Est. Value
About This Home
This home is located at 1041 Allyssa Ct, Lansing, KS 66043 and is currently estimated at $397,470, approximately $156 per square foot. 1041 Allyssa Ct is a home located in Leavenworth County with nearby schools including Lansing Elementary School, Lansing Middle 6-8, and Lansing High 9-12.
Ownership History
Date
Name
Owned For
Owner Type
Purchase Details
Closed on
Dec 28, 2006
Sold by
R & R Builders
Bought by
Trevino Mary B and Potts Ronald D
Current Estimated Value
Home Financials for this Owner
Home Financials are based on the most recent Mortgage that was taken out on this home.
Original Mortgage
$78,500
Outstanding Balance
$46,885
Interest Rate
6.2%
Mortgage Type
New Conventional
Estimated Equity
$350,585
Create a Home Valuation Report for This Property
The Home Valuation Report is an in-depth analysis detailing your home's value as well as a comparison with similar homes in the area
Home Values in the Area
Average Home Value in this Area
Purchase History
| Date | Buyer | Sale Price | Title Company |
|---|---|---|---|
| Trevino Mary B | $104,405 | Coffelt Land Title Inc |
Source: Public Records
Mortgage History
| Date | Status | Borrower | Loan Amount |
|---|---|---|---|
| Open | Trevino Mary B | $78,500 |
Source: Public Records
Tax History Compared to Growth
Tax History
| Year | Tax Paid | Tax Assessment Tax Assessment Total Assessment is a certain percentage of the fair market value that is determined by local assessors to be the total taxable value of land and additions on the property. | Land | Improvement |
|---|---|---|---|---|
| 2025 | $5,798 | $43,861 | $5,331 | $38,530 |
| 2024 | $5,591 | $42,906 | $5,331 | $37,575 |
| 2023 | $5,591 | $42,906 | $5,331 | $37,575 |
| 2022 | $5,226 | $37,938 | $3,328 | $34,610 |
| 2021 | $4,777 | $33,143 | $3,328 | $29,815 |
| 2020 | $4,427 | $30,245 | $3,328 | $26,917 |
| 2019 | $4,369 | $29,808 | $3,328 | $26,480 |
| 2018 | $4,183 | $28,569 | $3,328 | $25,241 |
| 2017 | $3,999 | $27,261 | $3,328 | $23,933 |
| 2016 | $3,960 | $26,990 | $3,328 | $23,662 |
| 2015 | $3,949 | $26,990 | $3,328 | $23,662 |
| 2014 | $3,721 | $25,978 | $3,328 | $22,650 |
Source: Public Records
Map
Nearby Homes
- 922 Southfork St
- 811 4-H Rd
- 866 Clearview Dr
- 875 Clearview Dr
- 527 S Valley Dr
- 1322 Rock Creek Ct
- 104 Olive St
- 1221 S Desoto Rd
- 833 Rock Creek Dr
- 522 Forestglen Ln
- 202 S Main St
- 124 S Main St
- 546 Hithergreen Dr
- 13788 McIntyre1 Rd
- 13788 Mcintyre Rd
- 13788 McIntyre2 Rd
- 24431 139th St
- 218 E Kay St
- 521 Hillbrook Dr
- 13965 Mc Intyre Rd
- 917 Allyssa Ct
- 1043 Allyssa Ct
- 915 Allyssa Ct
- 1045 Allyssa Ct
- 934 Southfork St
- 913 Allyssa Ct
- 931 Southfork St
- 1047 Allyssa Ct
- 1057 Wyndham Dr
- 932 Southfork St
- 911 Allyssa Ct
- 929 Southfork St
- 908 Allyssa Ct
- 909 Allyssa Ct
- 930 Southfork St
- 1051 Allyssa Ct
- 1053 Wyndham Dr
- 906 Allyssa Ct
- 907 Allyssa Ct
- 928 Southfork St