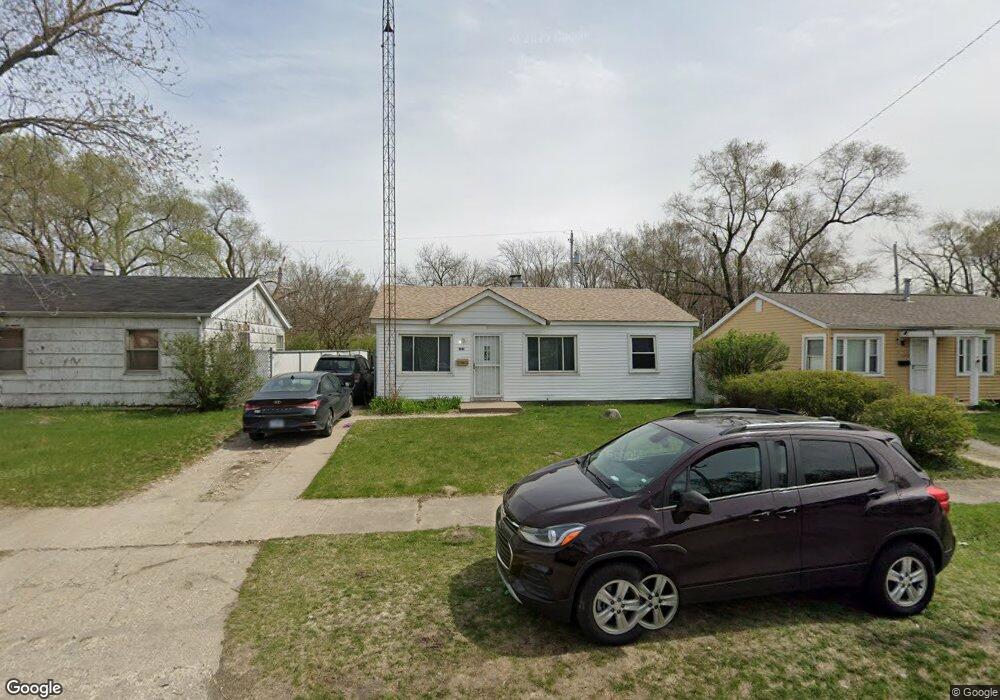
1041 Clay St Gary, IN 46403
Aetna NeighborhoodEstimated Value: $114,000 - $153,000
3
Beds
1
Bath
2,788
Sq Ft
$48/Sq Ft
Est. Value
About This Home
This home is located at 1041 Clay St, Gary, IN 46403 and is currently estimated at $134,890, approximately $48 per square foot. 1041 Clay St is a home located in Lake County with nearby schools including Banneker Elementary at Marquette, Gary Middle School, and West Side Leadership Academy.
Ownership History
Date
Name
Owned For
Owner Type
Purchase Details
Closed on
Jul 14, 2020
Sold by
1041 Clay Llc
Bought by
Szymanski Scott
Current Estimated Value
Home Financials for this Owner
Home Financials are based on the most recent Mortgage that was taken out on this home.
Original Mortgage
$63,750
Outstanding Balance
$56,259
Interest Rate
3.2%
Mortgage Type
New Conventional
Estimated Equity
$78,631
Purchase Details
Closed on
Jan 25, 2017
Sold by
Robinson Michael D
Bought by
1041 Clay Llc
Purchase Details
Closed on
Sep 23, 2016
Sold by
Cottrell Arthur J
Bought by
Robinson Michael D
Purchase Details
Closed on
Dec 30, 2013
Sold by
Centier Bank
Bought by
Cottrell Arthur J
Purchase Details
Closed on
Oct 4, 2013
Sold by
Cottrell Arthur and Johnson John B
Bought by
Centier Bank
Purchase Details
Closed on
Apr 9, 2012
Sold by
Cottrell Rosemary
Bought by
Cottrell Arthur
Create a Home Valuation Report for This Property
The Home Valuation Report is an in-depth analysis detailing your home's value as well as a comparison with similar homes in the area
Home Values in the Area
Average Home Value in this Area
Purchase History
| Date | Buyer | Sale Price | Title Company |
|---|---|---|---|
| Szymanski Scott | -- | Meridian Title Corp | |
| 1041 Clay Llc | -- | None Available | |
| Robinson Michael D | -- | None Available | |
| Cottrell Arthur J | -- | None Available | |
| Centier Bank | -- | None Available | |
| Cottrell Arthur | -- | None Available |
Source: Public Records
Mortgage History
| Date | Status | Borrower | Loan Amount |
|---|---|---|---|
| Open | Szymanski Scott | $63,750 |
Source: Public Records
Tax History
| Year | Tax Paid | Tax Assessment Tax Assessment Total Assessment is a certain percentage of the fair market value that is determined by local assessors to be the total taxable value of land and additions on the property. | Land | Improvement |
|---|---|---|---|---|
| 2025 | $1,552 | $65,000 | $3,800 | $61,200 |
| 2024 | $5,061 | $55,300 | $3,800 | $51,500 |
| 2023 | $1,253 | $57,400 | $3,800 | $53,600 |
| 2022 | $1,253 | $48,900 | $3,100 | $45,800 |
| 2021 | $1,145 | $44,700 | $3,100 | $41,600 |
| 2020 | $1,148 | $44,800 | $3,100 | $41,700 |
| 2019 | $1,121 | $45,000 | $3,100 | $41,900 |
| 2018 | $1,095 | $45,100 | $3,100 | $42,000 |
| 2017 | $1,097 | $45,900 | $3,100 | $42,800 |
| 2016 | $601 | $48,000 | $3,100 | $44,900 |
| 2014 | $1,781 | $76,100 | $3,800 | $72,300 |
| 2013 | $228 | $75,600 | $3,800 | $71,800 |
Source: Public Records
Map
Nearby Homes
- 1047 Decatur St
- 1171 Dearborn Cir
- 1121 Dekalb St
- 1151 Benton St
- 1235 Benton St
- 4514 E 10th Ave
- 1240 Benton St
- 836 Fayette St
- 4513 Miller Ave
- 859 Fayette St
- 866 Floyd St
- 4440 E 13th Place
- 5544 E 10th Ave
- 845 Floyd St
- 4240 E 12th Place
- 5617 E 13th Place
- 1330 Arizona St
- 1157 S Hamilton St
- 1012 Oklahoma St
- 940 Idaho St
Your Personal Tour Guide
Ask me questions while you tour the home.