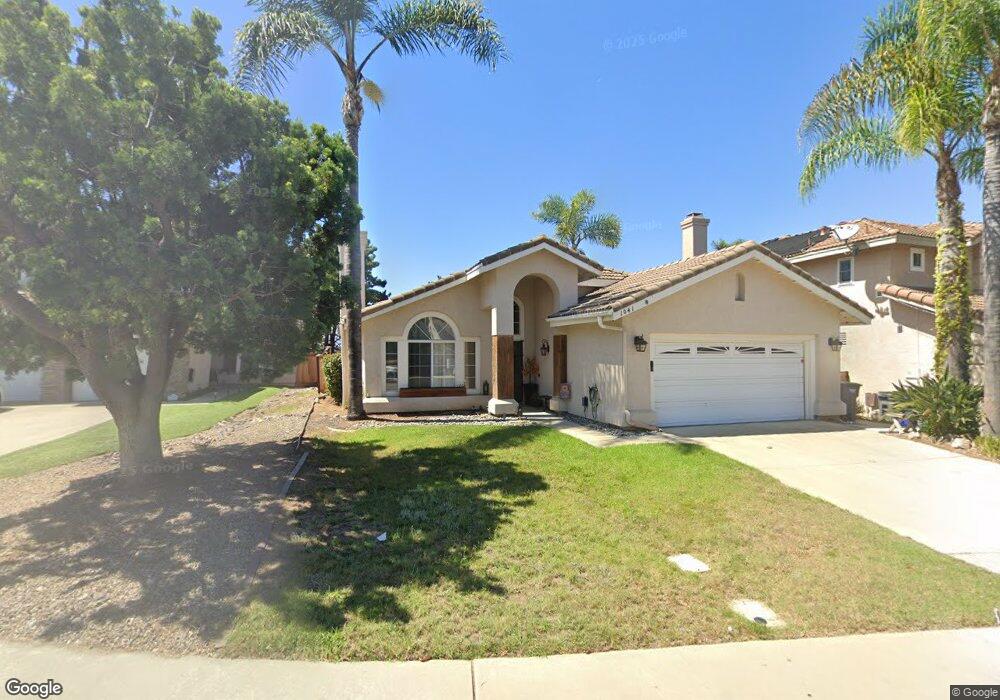
1041 Honeysuckle Dr San Marcos, CA 92078
Barham Discovery Community NeighborhoodEstimated Value: $999,712 - $1,200,000
3
Beds
2
Baths
1,482
Sq Ft
$721/Sq Ft
Est. Value
About This Home
This home is located at 1041 Honeysuckle Dr, San Marcos, CA 92078 and is currently estimated at $1,068,428, approximately $720 per square foot. 1041 Honeysuckle Dr is a home located in San Diego County with nearby schools including Discovery Elementary School, San Elijo Middle School, and San Marcos High School.
Ownership History
Date
Name
Owned For
Owner Type
Purchase Details
Closed on
Sep 22, 2015
Sold by
Overbeck Donald R and Overback Bettina R
Bought by
Byer Brandon D and Byer Laura M
Current Estimated Value
Home Financials for this Owner
Home Financials are based on the most recent Mortgage that was taken out on this home.
Original Mortgage
$486,034
Outstanding Balance
$379,650
Interest Rate
3.75%
Mortgage Type
FHA
Estimated Equity
$688,778
Purchase Details
Closed on
May 14, 1996
Sold by
Overbeck Donald R and Overbeck Bettina R
Bought by
Overbeck Donald R and Overbeck Bettina R
Purchase Details
Closed on
Feb 9, 1994
Sold by
Overbeck Donald R and Overbeck Bettina R
Bought by
Overbeck Donald R and Overbeck Bettina R
Home Financials for this Owner
Home Financials are based on the most recent Mortgage that was taken out on this home.
Original Mortgage
$113,000
Interest Rate
7.24%
Purchase Details
Closed on
Dec 15, 1992
Create a Home Valuation Report for This Property
The Home Valuation Report is an in-depth analysis detailing your home's value as well as a comparison with similar homes in the area
Home Values in the Area
Average Home Value in this Area
Purchase History
| Date | Buyer | Sale Price | Title Company |
|---|---|---|---|
| Byer Brandon D | $495,000 | Fidelity National Title | |
| Overbeck Donald R | -- | -- | |
| Overbeck Donald R | -- | Fidelity National Title | |
| -- | $187,900 | -- |
Source: Public Records
Mortgage History
| Date | Status | Borrower | Loan Amount |
|---|---|---|---|
| Open | Byer Brandon D | $486,034 | |
| Previous Owner | Overbeck Donald R | $113,000 |
Source: Public Records
Tax History Compared to Growth
Tax History
| Year | Tax Paid | Tax Assessment Tax Assessment Total Assessment is a certain percentage of the fair market value that is determined by local assessors to be the total taxable value of land and additions on the property. | Land | Improvement |
|---|---|---|---|---|
| 2025 | $6,828 | $585,973 | $426,164 | $159,809 |
| 2024 | $6,828 | $574,484 | $417,808 | $156,676 |
| 2023 | $6,705 | $563,220 | $409,616 | $153,604 |
| 2022 | $6,615 | $552,178 | $401,585 | $150,593 |
| 2021 | $6,509 | $541,352 | $393,711 | $147,641 |
| 2020 | $6,447 | $535,802 | $389,674 | $146,128 |
| 2019 | $6,313 | $525,297 | $382,034 | $143,263 |
| 2018 | $6,119 | $514,998 | $374,544 | $140,454 |
| 2017 | $6,001 | $504,900 | $367,200 | $137,700 |
| 2016 | $5,912 | $495,000 | $360,000 | $135,000 |
| 2015 | $4,161 | $272,620 | $118,999 | $153,621 |
| 2014 | $4,075 | $267,280 | $116,668 | $150,612 |
Source: Public Records
Map
Nearby Homes
- 1021 Mockingbird Ln
- 1027 Cima Dr
- 1261 Granada Way
- 1048 Via Vera Cruz
- 1054 La Sombra Dr
- 1051 La Reina Dr
- 984 San Pablo Dr
- 1286 Discovery St Unit 92
- 1286 Discovery St Unit SPC 16
- 1286 Discovery St Unit 47
- 1286 Discovery St Unit 148
- 1310 Miracielo Ct
- 1267 Discovery St
- 1050 San Pablo Dr
- 0 Vista Colina
- 1911 La Subida Way
- 797 Trailside Place
- 1324 Vista Colina Dr
- 1916 Fairway Circle Dr
- 1940 Fairway Circle Dr
- 1039 Honeysuckle Dr
- 1043 Honeysuckle Dr
- 1045 Honeysuckle Dr
- 1037 Honeysuckle Dr
- 1407 Dr
- 1026 Honeysuckle Dr
- 1047 Honeysuckle Dr
- 997 Gardenia Ct
- 1035 Honeysuckle Dr
- 1049 Honeysuckle Dr
- 1024 Honeysuckle Dr
- 1029 Honeysuckle Dr
- 995 Gardenia Ct
- 1560 Cir
- 1027 Honeysuckle Dr
- 1051 Honeysuckle Dr
- 1022 Honeysuckle Dr
- 1048 Honeysuckle Dr
- 991 Gardenia Ct
- 1053 Honeysuckle Dr