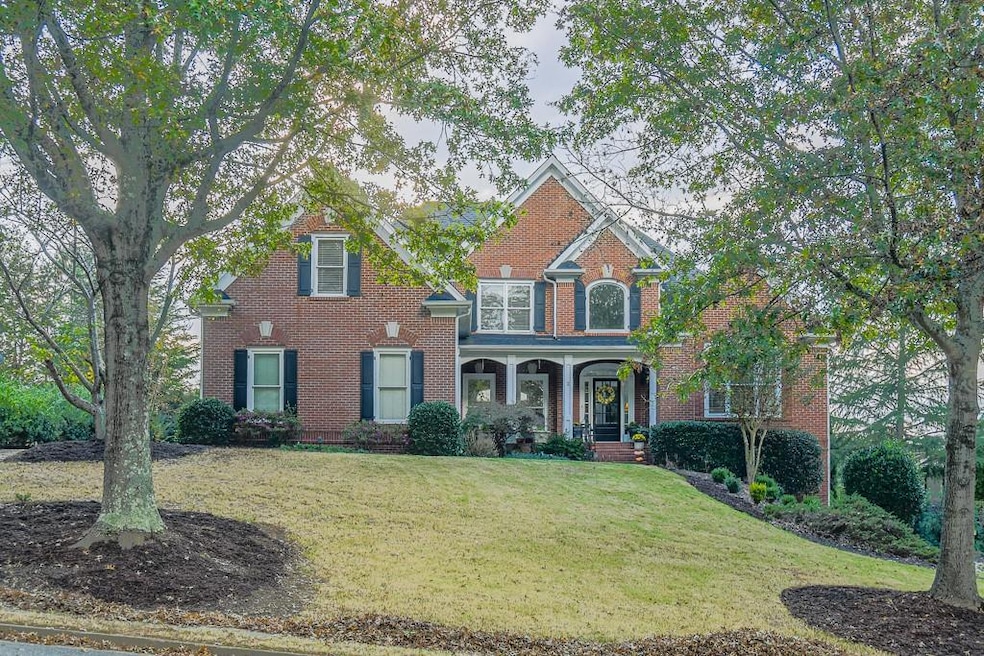
1041 Windermere Crossing Cumming, GA 30041
Estimated payment $7,569/month
Highlights
- On Golf Course
- Country Club
- Sitting Area In Primary Bedroom
- Haw Creek Elementary School Rated A
- Media Room
- Dining Room Seats More Than Twelve
About This Home
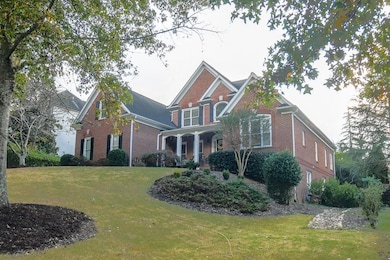
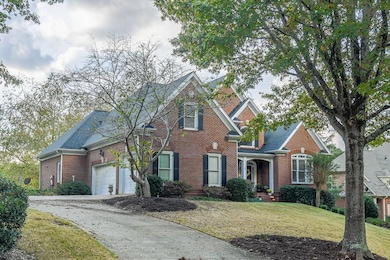
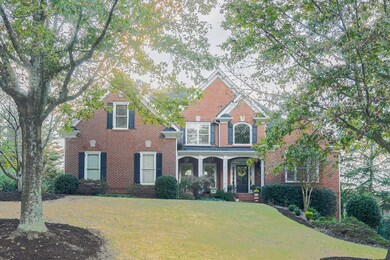
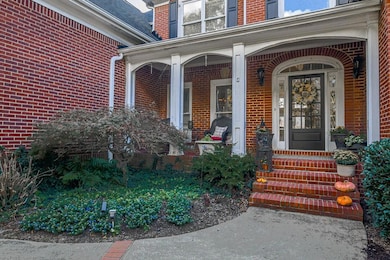
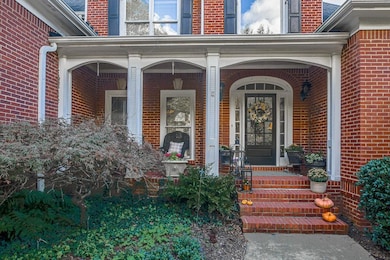
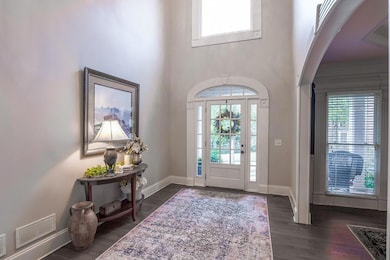
Experience refined living at 1041 Windermere Crossing an elegant single-family residence nestled within the prestigious Windermere community. This beautifully appointed home showcases timeless design, soaring 20-foot ceilings in the great room, and impeccable craftsmanship throughout. The chef’s kitchen features high-end appliances, granite countertops, and a spacious island that seamlessly connects to the bright and inviting living area perfect for entertaining in style. Step outside to a private backyard patio complete with a permanent attached gas grill, ideal for year-round gatherings. The primary suite offers a serene retreat with a spa-inspired bathroom and generous walk-in closet. Located along the 13th hole of the Windermere Golf Course, this home provides stunning views and a true country club lifestyle. Residents enjoy exclusive access to resort-style amenities, including championship golf, tennis courts, swimming, and scenic walking trails. Home is occupied, not vacant. Ideally located near top-rated schools, fine dining, and upscale shopping.

Home Details
Home Type
- Single Family
Est. Annual Taxes
- $8,628
Year Built
- Built in 2000
Lot Details
- 0.36 Acre Lot
- On Golf Course
- Landscaped
- Level Lot
- Irrigation Equipment
HOA Fees
- $117 Monthly HOA Fees
Parking
- 3 Car Attached Garage
- Parking Accessed On Kitchen Level
- Side Facing Garage
- Driveway Level
Home Design
- Traditional Architecture
- Brick Foundation
- Tile Roof
- Four Sided Brick Exterior Elevation
Interior Spaces
- 5,977 Sq Ft Home
- 2-Story Property
- Wet Bar
- Rear Stairs
- Tray Ceiling
- Vaulted Ceiling
- Ceiling Fan
- Gas Log Fireplace
- Insulated Windows
- Two Story Entrance Foyer
- Family Room with Fireplace
- 3 Fireplaces
- Great Room
- Dining Room Seats More Than Twelve
- Formal Dining Room
- Media Room
- Home Office
- Keeping Room with Fireplace
- Home Gym
- Golf Course Views
- Pull Down Stairs to Attic
- Fire and Smoke Detector
- Laundry Room
Kitchen
- Eat-In Kitchen
- Breakfast Bar
- Double Oven
- Gas Range
- Microwave
- Dishwasher
- Solid Surface Countertops
- Wood Stained Kitchen Cabinets
Flooring
- Wood
- Carpet
Bedrooms and Bathrooms
- Sitting Area In Primary Bedroom
- 4 Bedrooms | 1 Primary Bedroom on Main
- Walk-In Closet
- Vaulted Bathroom Ceilings
- Dual Vanity Sinks in Primary Bathroom
- Whirlpool Bathtub
- Separate Shower in Primary Bathroom
Finished Basement
- Basement Fills Entire Space Under The House
- Interior and Exterior Basement Entry
- Fireplace in Basement
- Stubbed For A Bathroom
- Natural lighting in basement
Outdoor Features
- Deck
- Patio
- Front Porch
Schools
- Haw Creek Elementary School
- South Forsyth Middle School
- South Forsyth High School
Utilities
- Forced Air Zoned Heating and Cooling System
- Heating System Uses Natural Gas
- 220 Volts
- 110 Volts
- High Speed Internet
Listing and Financial Details
- Assessor Parcel Number 203 051
Community Details
Overview
- Windermere Subdivision
Amenities
- Clubhouse
Recreation
- Golf Course Community
- Country Club
- Tennis Courts
- Community Playground
- Community Pool
Map
Home Values in the Area
Average Home Value in this Area
Tax History
| Year | Tax Paid | Tax Assessment Tax Assessment Total Assessment is a certain percentage of the fair market value that is determined by local assessors to be the total taxable value of land and additions on the property. | Land | Improvement |
|---|---|---|---|---|
| 2025 | $8,628 | $454,004 | $84,000 | $370,004 |
| 2024 | $8,628 | $419,060 | $76,000 | $343,060 |
| 2023 | $8,233 | $413,028 | $66,000 | $347,028 |
| 2022 | $7,273 | $232,160 | $38,000 | $194,160 |
| 2021 | $5,922 | $232,160 | $38,000 | $194,160 |
| 2020 | $5,965 | $234,228 | $38,000 | $196,228 |
| 2019 | $5,681 | $220,056 | $38,000 | $182,056 |
| 2018 | $5,569 | $213,848 | $38,000 | $175,848 |
| 2017 | $5,481 | $208,684 | $38,000 | $170,684 |
| 2016 | $5,481 | $208,684 | $38,000 | $170,684 |
| 2015 | $5,491 | $208,684 | $38,000 | $170,684 |
| 2014 | $4,916 | $193,836 | $38,000 | $155,836 |
Property History
| Date | Event | Price | List to Sale | Price per Sq Ft |
|---|---|---|---|---|
| 10/19/2025 10/19/25 | For Sale | $1,275,000 | -- | $213 / Sq Ft |
Purchase History
| Date | Type | Sale Price | Title Company |
|---|---|---|---|
| Deed | $615,000 | -- | |
| Deed | $489,500 | -- |
Mortgage History
| Date | Status | Loan Amount | Loan Type |
|---|---|---|---|
| Open | $417,000 | New Conventional | |
| Previous Owner | $344,800 | New Conventional |
Source: First Multiple Listing Service (FMLS)
MLS Number: 7667549
APN: 203-051
Disclaimer: Certain information contained herein is derived from information provided by parties other than Homes.com. All information provided is deemed reliable, but is not guaranteed to be accurate and should be independently verified.
![]() Listings identified with the FMLS IDX logo come from FMLS and are held by brokerage firms other than the owner of this website. The listing brokerage is identified in any listing details. Information is deemed reliable but is not guaranteed. If you believe any FMLS listing contains material that infringes your copyrighted work please visit www.fmls.com/dmca to review our DMCA policy and learn how to submit a takedown request. © 2025 First Multiple Listing Service, Inc.
Listings identified with the FMLS IDX logo come from FMLS and are held by brokerage firms other than the owner of this website. The listing brokerage is identified in any listing details. Information is deemed reliable but is not guaranteed. If you believe any FMLS listing contains material that infringes your copyrighted work please visit www.fmls.com/dmca to review our DMCA policy and learn how to submit a takedown request. © 2025 First Multiple Listing Service, Inc.
- 3100 Preston Pointe Way
- 1680 Sugar Ridge Dr
- 1265 Wondering Way
- 2845 Stratfield Ct
- 1040 Rockbass Rd
- 1015 Pebble Creek Trail
- 630 Rockbass Rd
- 4645 Cold Spring Ct
- 2945 Links View Way
- 2470 Cambridge Hills Rd
- 345 Blackwood Ln
- 3140 Scarlet Oak Pass
- 3745 Jardine Ln
- 4315 Wykeshire Ct
- 4595 Essen Ln
- 2173 Holly Ct
- 815 Earlham Dr
- 3610 Crowchild Dr
- 2080 One White Oak Ln
- 2080 One White Oak Ln Unit 5106