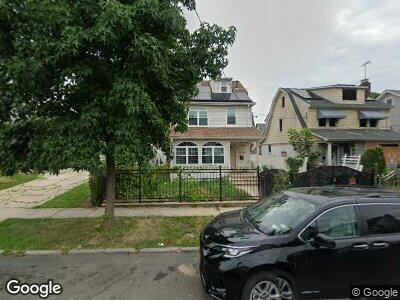
10411 197th St Saint Albans, NY 11412
Hollis NeighborhoodEstimated Value: $712,001 - $799,000
--
Bed
--
Bath
1,532
Sq Ft
$490/Sq Ft
Est. Value
About This Home
This home is located at 10411 197th St, Saint Albans, NY 11412 and is currently estimated at $750,250, approximately $489 per square foot. 10411 197th St is a home located in Queens County with nearby schools including P.S. 118 Lorraine Hansberry, I.S. 192 The Linden, and Wellspring Elementary & Middle.
Ownership History
Date
Name
Owned For
Owner Type
Purchase Details
Closed on
Sep 11, 2020
Sold by
Mendez-Bravo Magaly
Bought by
Haque Dedarul
Current Estimated Value
Home Financials for this Owner
Home Financials are based on the most recent Mortgage that was taken out on this home.
Original Mortgage
$475,800
Interest Rate
2.7%
Mortgage Type
New Conventional
Purchase Details
Closed on
Jun 19, 2007
Sold by
D T S Equities Inc
Bought by
Mendez-Bravo Magaly
Home Financials for this Owner
Home Financials are based on the most recent Mortgage that was taken out on this home.
Original Mortgage
$125,000
Interest Rate
6.39%
Purchase Details
Closed on
Oct 4, 2006
Sold by
Valme Antonio and Valme Guetteline
Bought by
Dts Equities Inc
Home Financials for this Owner
Home Financials are based on the most recent Mortgage that was taken out on this home.
Original Mortgage
$351,000
Interest Rate
6.49%
Mortgage Type
Purchase Money Mortgage
Create a Home Valuation Report for This Property
The Home Valuation Report is an in-depth analysis detailing your home's value as well as a comparison with similar homes in the area
Home Values in the Area
Average Home Value in this Area
Purchase History
| Date | Buyer | Sale Price | Title Company |
|---|---|---|---|
| Haque Dedarul | $610,000 | -- | |
| Mendez-Bravo Magaly | $625,000 | -- | |
| Mendez-Bravo Magaly | $625,000 | -- | |
| Dts Equities Inc | $390,000 | -- | |
| Dts Equities Inc | $390,000 | -- |
Source: Public Records
Mortgage History
| Date | Status | Borrower | Loan Amount |
|---|---|---|---|
| Previous Owner | Haque Dedarul | $475,800 | |
| Previous Owner | Mendez-Bravo Magaly | $125,000 | |
| Previous Owner | Mendez-Bravo Magaly | $500,000 | |
| Previous Owner | Dts Equities Inc | $351,000 | |
| Previous Owner | Valme Antonio | $102,000 |
Source: Public Records
Tax History Compared to Growth
Tax History
| Year | Tax Paid | Tax Assessment Tax Assessment Total Assessment is a certain percentage of the fair market value that is determined by local assessors to be the total taxable value of land and additions on the property. | Land | Improvement |
|---|---|---|---|---|
| 2024 | $5,105 | $28,862 | $7,544 | $21,318 |
| 2023 | $5,709 | $28,426 | $8,224 | $20,202 |
| 2022 | $4,673 | $41,700 | $11,700 | $30,000 |
| 2021 | $5,634 | $34,560 | $11,700 | $22,860 |
| 2020 | $5,397 | $32,820 | $11,700 | $21,120 |
| 2019 | $5,031 | $34,320 | $11,700 | $22,620 |
| 2018 | $4,829 | $23,688 | $8,666 | $15,022 |
| 2017 | $4,565 | $22,394 | $10,275 | $12,119 |
| 2016 | $4,460 | $22,394 | $10,275 | $12,119 |
| 2015 | $2,548 | $21,246 | $11,701 | $9,545 |
| 2014 | $2,548 | $20,044 | $11,446 | $8,598 |
Source: Public Records
Map
Nearby Homes
- 104-35 198th St
- 104-3 196th St
- 100-36 197th St Unit 2
- 100-32 199th St
- 199-20 100th Ave
- 104-21 201st St
- 194-12 100th Ave
- 19907 100th Ave
- 9920 196th St
- 10041 201st St
- 194-10 100th Ave
- 104-38 202nd St
- 201-15 109th Ave
- 200-21 Hollis Ave
- 104-15 202nd St
- 109-12 202nd St
- 202-02 109th Ave
- 99-11 200th St
- 10961 200th St
- 193-21 109th Rd
- 10411 197th St
- 104-11 197th St Unit 1
- 104-11 197th St
- 104-27 197th St
- 10415 197th St
- 10419 197th St
- 19708 104th Ave
- 10419 197th St
- 19702 104th Ave
- 19708 104th Ave
- 19712 104th Ave
- 10412 198th St
- 10416 198th St
- 104-16 198th St
- 10423 197th St
- 10420 198th St
- 19716 104th Ave
- 19716 104th Ave
- 104-34 197th St
- 19620 104th Ave