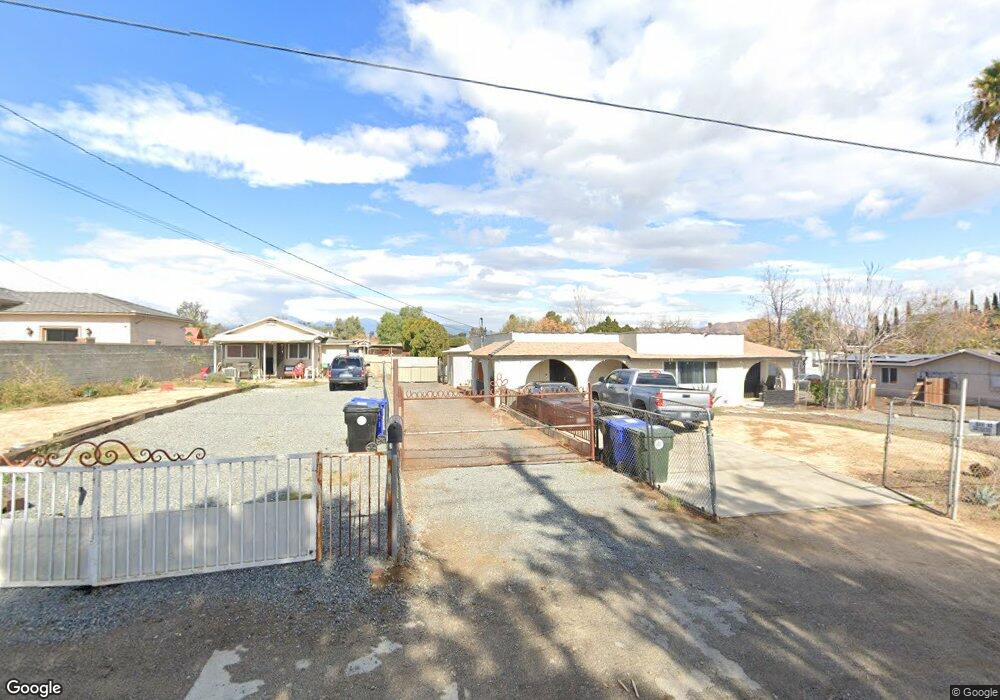
10411 54th St Mira Loma, CA 91752
Estimated Value: $663,000 - $805,000
3
Beds
3
Baths
1,782
Sq Ft
$405/Sq Ft
Est. Value
About This Home
This home is located at 10411 54th St, Mira Loma, CA 91752 and is currently estimated at $721,000, approximately $404 per square foot. 10411 54th St is a home located in Riverside County with nearby schools including Troth Street Elementary School, Mira Loma Middle School, and Jurupa Valley High School.
Ownership History
Date
Name
Owned For
Owner Type
Purchase Details
Closed on
Jul 3, 2019
Sold by
Cabral Luz M
Bought by
Cabral Angel J
Current Estimated Value
Home Financials for this Owner
Home Financials are based on the most recent Mortgage that was taken out on this home.
Original Mortgage
$225,000
Interest Rate
3.73%
Mortgage Type
New Conventional
Purchase Details
Closed on
Jun 7, 2019
Sold by
Rosales Raymundo A
Bought by
Cabral Angel J
Home Financials for this Owner
Home Financials are based on the most recent Mortgage that was taken out on this home.
Original Mortgage
$225,000
Interest Rate
3.73%
Mortgage Type
New Conventional
Purchase Details
Closed on
Mar 22, 2012
Sold by
Rosales Belen C
Bought by
Cabral Angel J
Purchase Details
Closed on
Feb 2, 2005
Sold by
Rosales Belen C
Bought by
Rosales Belen C and The Belen C Rosales Trust
Create a Home Valuation Report for This Property
The Home Valuation Report is an in-depth analysis detailing your home's value as well as a comparison with similar homes in the area
Home Values in the Area
Average Home Value in this Area
Purchase History
| Date | Buyer | Sale Price | Title Company |
|---|---|---|---|
| Cabral Angel J | -- | Provident Title Company | |
| Cabral Angel J | -- | Provident Title Company | |
| Cabral Angel J | $50,000 | None Available | |
| Rosales Belen C | -- | -- |
Source: Public Records
Mortgage History
| Date | Status | Borrower | Loan Amount |
|---|---|---|---|
| Previous Owner | Cabral Angel J | $225,000 |
Source: Public Records
Tax History Compared to Growth
Tax History
| Year | Tax Paid | Tax Assessment Tax Assessment Total Assessment is a certain percentage of the fair market value that is determined by local assessors to be the total taxable value of land and additions on the property. | Land | Improvement |
|---|---|---|---|---|
| 2025 | $3,319 | $251,197 | $100,477 | $150,720 |
| 2023 | $3,319 | $241,444 | $96,576 | $144,868 |
| 2022 | $3,318 | $236,711 | $94,683 | $142,028 |
| 2021 | $3,226 | $232,071 | $92,827 | $139,244 |
| 2020 | $3,143 | $229,693 | $91,876 | $137,817 |
| 2019 | $2,837 | $225,190 | $90,075 | $135,115 |
| 2018 | $2,469 | $220,775 | $88,309 | $132,466 |
| 2017 | $2,444 | $216,447 | $86,578 | $129,869 |
| 2016 | $2,411 | $212,204 | $84,881 | $127,323 |
| 2015 | $2,379 | $209,018 | $83,607 | $125,411 |
| 2014 | $2,216 | $204,925 | $81,970 | $122,955 |
Source: Public Records
Map
Nearby Homes
- 10538 54th St
- 10457 50th St
- 10517 50th St
- 4795 Bain St
- 11101 Gemini Ct
- 5685 Ptolemy Way
- 4715 Bain St
- 4900 Eclipse Ave
- 9745 55th St
- 6093 Troth St
- 9950 60th St
- 5286 Trail Canyon Dr
- 11187 58th St
- 9600 51st St
- 9567 51st St
- 11234 Owen Ct
- 4737 Hot Creek Rd
- 0 60th St Unit IV22125232
- 4775 Wanamaker Dr
- 6415 Etiwanda Ave