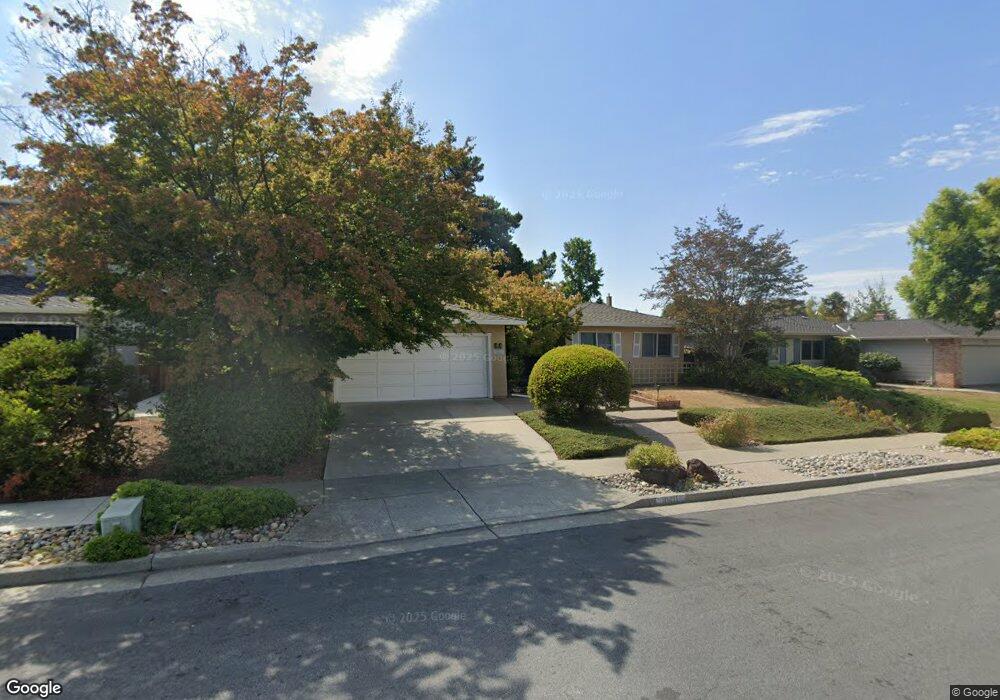
10411 Castine Ave Cupertino, CA 95014
North Cupertino NeighborhoodEstimated Value: $2,935,796 - $3,730,000
3
Beds
2
Baths
1,666
Sq Ft
$1,938/Sq Ft
Est. Value
About This Home
This home is located at 10411 Castine Ave, Cupertino, CA 95014 and is currently estimated at $3,228,949, approximately $1,938 per square foot. 10411 Castine Ave is a home located in Santa Clara County with nearby schools including Garden Gate Elementary School, Sam H. Lawson Middle School, and Monta Vista High School.
Ownership History
Date
Name
Owned For
Owner Type
Purchase Details
Closed on
Dec 19, 2011
Sold by
Neo Chiew Mooi and Ho Kum Fei
Bought by
Ho Kum Fei and Neo Chiew Mooi
Current Estimated Value
Purchase Details
Closed on
Jun 8, 2007
Sold by
Devgan Sanjay K and Devgan Jacqueline S
Bought by
Neo Chiew Mooi and Ho Kum Fei
Home Financials for this Owner
Home Financials are based on the most recent Mortgage that was taken out on this home.
Original Mortgage
$1,020,650
Outstanding Balance
$464,397
Interest Rate
1.75%
Mortgage Type
Negative Amortization
Estimated Equity
$2,764,552
Purchase Details
Closed on
Oct 13, 2003
Sold by
Hawn Robert E and Hawn Rosanne K
Bought by
Devgan Sanjay K and Devgan Jacqueline S
Home Financials for this Owner
Home Financials are based on the most recent Mortgage that was taken out on this home.
Original Mortgage
$567,000
Interest Rate
4.75%
Mortgage Type
Purchase Money Mortgage
Purchase Details
Closed on
Jun 27, 2000
Sold by
Hawn Robert E and Hawn Rosanne K
Bought by
Hawn Robert E and Hawn Rosanne K
Create a Home Valuation Report for This Property
The Home Valuation Report is an in-depth analysis detailing your home's value as well as a comparison with similar homes in the area
Home Values in the Area
Average Home Value in this Area
Purchase History
| Date | Buyer | Sale Price | Title Company |
|---|---|---|---|
| Ho Kum Fei | -- | None Available | |
| Neo Chiew Mooi | $1,361,000 | First American Title Company | |
| Devgan Sanjay K | $810,000 | Alliance Title Company | |
| Hawn Robert E | -- | -- |
Source: Public Records
Mortgage History
| Date | Status | Borrower | Loan Amount |
|---|---|---|---|
| Open | Neo Chiew Mooi | $1,020,650 | |
| Previous Owner | Devgan Sanjay K | $567,000 | |
| Closed | Devgan Sanjay K | $162,000 |
Source: Public Records
Tax History Compared to Growth
Tax History
| Year | Tax Paid | Tax Assessment Tax Assessment Total Assessment is a certain percentage of the fair market value that is determined by local assessors to be the total taxable value of land and additions on the property. | Land | Improvement |
|---|---|---|---|---|
| 2025 | $21,712 | $1,823,287 | $1,473,761 | $349,526 |
| 2024 | $21,712 | $1,787,537 | $1,444,864 | $342,673 |
| 2023 | $21,520 | $1,752,488 | $1,416,534 | $335,954 |
| 2022 | $21,300 | $1,718,126 | $1,388,759 | $329,367 |
| 2021 | $21,076 | $1,684,438 | $1,361,529 | $322,909 |
| 2020 | $20,818 | $1,667,167 | $1,347,569 | $319,598 |
| 2019 | $20,314 | $1,634,479 | $1,321,147 | $313,332 |
| 2018 | $19,672 | $1,602,432 | $1,295,243 | $307,189 |
| 2017 | $19,543 | $1,571,013 | $1,269,847 | $301,166 |
| 2016 | $18,920 | $1,540,210 | $1,244,949 | $295,261 |
| 2015 | $18,785 | $1,517,075 | $1,226,249 | $290,826 |
| 2014 | $18,299 | $1,487,359 | $1,202,229 | $285,130 |
Source: Public Records
Map
Nearby Homes
- 10405 Mary Ave
- 10461 Mary Ave Unit 73
- 10683 Pebble Place
- 21035 Lauretta Dr
- 10715 Grapnel Place
- 10091 Santa Clara Ave
- 10350 Mann Dr
- 974 Pocatello Ave
- 10837 N Stelling Rd
- 1768 Karameos Ct
- 21685 Olive Ave
- 1014 W Homestead Rd
- 10500 Creston Dr
- 20666 Celeste Cir Unit 59
- 20676 Celeste Cir Unit 71
- 21686 Olive Ave
- 21851 Almaden Ave
- 22081 Caroline Dr
- 10193 Miner Place
- 21091 Red Fir Ct
- 10401 Castine Ave
- 10421 Castine Ave
- 10412 Chisholm Ave
- 10422 Chisholm Ave
- 10402 Chisholm Ave
- 10441 Castine Ave
- 10391 Castine Ave
- 10410 Castine Ave
- 10442 Chisholm Ave
- 10400 Castine Ave
- 10420 Castine Ave
- 21324 Dexter Dr
- 10390 Castine Ave
- 10461 Castine Ave
- 10440 Castine Ave
- 21295 Rumford Dr
- 21305 Rumford Dr
- 10462 Chisholm Ave
- 10380 Castine Ave
- 21315 Rumford Dr