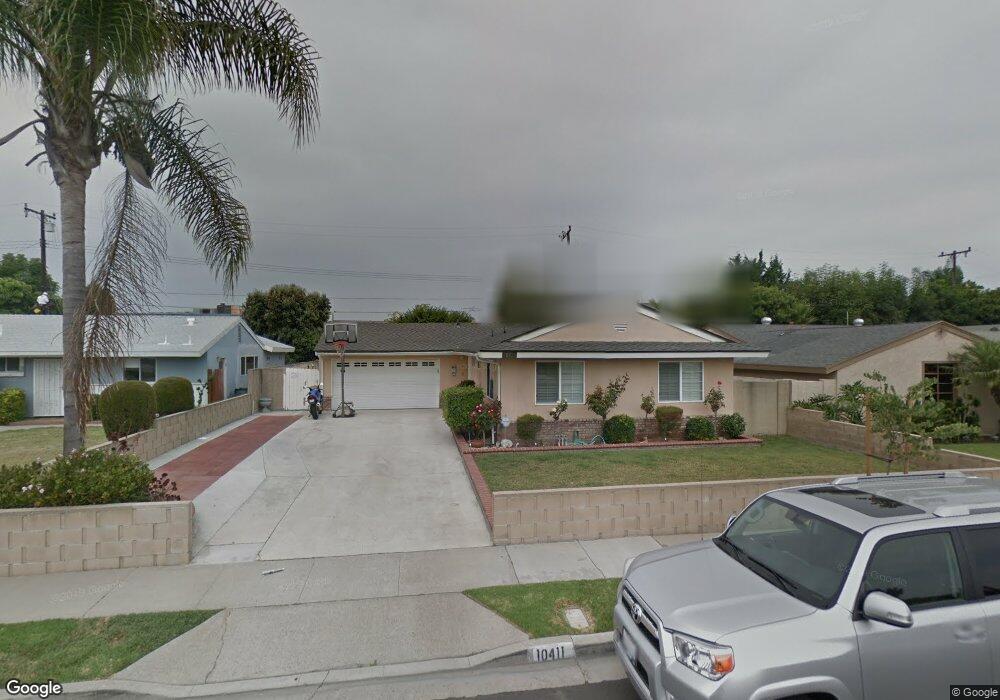
10411 Longden St Cypress, CA 90630
Estimated Value: $927,000 - $1,038,569
4
Beds
3
Baths
1,626
Sq Ft
$606/Sq Ft
Est. Value
About This Home
This home is located at 10411 Longden St, Cypress, CA 90630 and is currently estimated at $985,392, approximately $606 per square foot. 10411 Longden St is a home located in Orange County with nearby schools including Juliet Morris Elementary School, Lexington Junior High School, and Cypress High School.
Ownership History
Date
Name
Owned For
Owner Type
Purchase Details
Closed on
Jun 13, 2016
Sold by
Saw Clement C and Saw Maria Villamater
Bought by
Saw Family Trust
Current Estimated Value
Purchase Details
Closed on
Sep 30, 1998
Sold by
Duchoviner Gertrude
Bought by
Saw Clement C and Saw Maria Villamater
Home Financials for this Owner
Home Financials are based on the most recent Mortgage that was taken out on this home.
Original Mortgage
$150,400
Outstanding Balance
$32,078
Interest Rate
6.6%
Estimated Equity
$953,314
Purchase Details
Closed on
Jul 25, 1997
Sold by
Duchovinner Gertrude
Bought by
Duchoviner Gertrude and Gertrude Duchoviner Living Trust
Purchase Details
Closed on
Mar 31, 1997
Sold by
Hardcastle Kevin W and Hardcastle Ruth E
Bought by
Duchoviner Gertrude
Home Financials for this Owner
Home Financials are based on the most recent Mortgage that was taken out on this home.
Original Mortgage
$133,000
Interest Rate
7.86%
Create a Home Valuation Report for This Property
The Home Valuation Report is an in-depth analysis detailing your home's value as well as a comparison with similar homes in the area
Home Values in the Area
Average Home Value in this Area
Purchase History
| Date | Buyer | Sale Price | Title Company |
|---|---|---|---|
| Saw Family Trust | -- | None Available | |
| Saw Clement C | $188,000 | First Southwestern Title Co | |
| Duchoviner Gertrude | -- | -- | |
| Duchoviner Gertrude | $178,000 | Fidelity National Title Ins |
Source: Public Records
Mortgage History
| Date | Status | Borrower | Loan Amount |
|---|---|---|---|
| Open | Saw Clement C | $150,400 | |
| Previous Owner | Duchoviner Gertrude | $133,000 |
Source: Public Records
Tax History
| Year | Tax Paid | Tax Assessment Tax Assessment Total Assessment is a certain percentage of the fair market value that is determined by local assessors to be the total taxable value of land and additions on the property. | Land | Improvement |
|---|---|---|---|---|
| 2025 | $4,107 | $349,028 | $225,006 | $124,022 |
| 2024 | $4,107 | $342,185 | $220,594 | $121,591 |
| 2023 | $4,012 | $335,476 | $216,269 | $119,207 |
| 2022 | $3,964 | $328,899 | $212,029 | $116,870 |
| 2021 | $3,912 | $322,450 | $207,871 | $114,579 |
| 2020 | $3,896 | $319,144 | $205,739 | $113,405 |
| 2019 | $3,791 | $312,887 | $201,705 | $111,182 |
| 2018 | $3,740 | $306,752 | $197,750 | $109,002 |
| 2017 | $3,615 | $300,738 | $193,873 | $106,865 |
| 2016 | $3,585 | $294,842 | $190,072 | $104,770 |
| 2015 | $3,558 | $290,414 | $187,217 | $103,197 |
| 2014 | $3,373 | $284,726 | $183,550 | $101,176 |
Source: Public Records
Map
Nearby Homes
- 10411 Saint Alban St
- 5482 Myra Ave
- 10292 Ethel St
- 5068 Cumberland Dr
- 10441 Rexford Dr
- 5353 Cumberland Dr
- 10947 Carrillo Ct
- 4611 Myra Ave
- 9948 Del Rio Way Unit 98
- 9598 Naples Dr
- 4385 Larwin Ave
- 5372 Harvard Way
- 4449 Avenida Granada
- 4790 Montefino Dr
- 9011 Cerise Ln Unit 129
- 9001 Cerise Ln Unit 109
- 9001 Cerise Ln Unit 113
- 6007 Clementine Ln Unit 21
- 4305 Larwin Ave
- 5000 Clementine Ln
- 10401 Longden St
- 10442 Saratoga St
- 10432 Saratoga St
- 10454 Saratoga St
- 10441 Longden St
- 10381 Longden St
- 10412 Longden St
- 10402 Longden St
- 10424 Saratoga St
- 10422 Longden St
- 10464 Saratoga St
- 10451 Longden St
- 10371 Longden St
- 10382 Longden St
- 10442 Longden St
- 5199 Saratoga Ave
- 10443 Saratoga St
- 10433 Saratoga St
- 10372 Longden St
- 5181 Laurel Ave
Your Personal Tour Guide
Ask me questions while you tour the home.