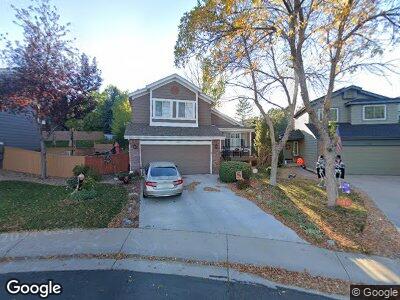
10411 Lynx Bay Lone Tree, CO 80124
Southridge NeighborhoodEstimated Value: $600,000 - $600,917
3
Beds
3
Baths
1,480
Sq Ft
$406/Sq Ft
Est. Value
About This Home
This home is located at 10411 Lynx Bay, Lone Tree, CO 80124 and is currently estimated at $600,459, approximately $405 per square foot. 10411 Lynx Bay is a home located in Douglas County with nearby schools including Wildcat Mountain Elementary School, Rocky Heights Middle School, and Rock Canyon High School.
Ownership History
Date
Name
Owned For
Owner Type
Purchase Details
Closed on
Mar 21, 2001
Sold by
Kimmell Jeffrey J and Kimmell Stephanie F
Bought by
Clay Mark Neil and Clay Molly A
Current Estimated Value
Home Financials for this Owner
Home Financials are based on the most recent Mortgage that was taken out on this home.
Original Mortgage
$196,721
Interest Rate
6.95%
Mortgage Type
FHA
Purchase Details
Closed on
Jan 2, 1997
Sold by
Kdb Homes Inc
Bought by
Kimmell Jeffrey J and Kimmell Stephanie F
Home Financials for this Owner
Home Financials are based on the most recent Mortgage that was taken out on this home.
Original Mortgage
$142,434
Interest Rate
7.54%
Mortgage Type
FHA
Create a Home Valuation Report for This Property
The Home Valuation Report is an in-depth analysis detailing your home's value as well as a comparison with similar homes in the area
Home Values in the Area
Average Home Value in this Area
Purchase History
| Date | Buyer | Sale Price | Title Company |
|---|---|---|---|
| Clay Mark Neil | $199,950 | -- | |
| Kimmell Jeffrey J | $145,506 | First American Heritage Titl |
Source: Public Records
Mortgage History
| Date | Status | Borrower | Loan Amount |
|---|---|---|---|
| Open | Clay Mark Neil | $411,000 | |
| Closed | Clay Mark Neil | $348,550 | |
| Closed | Clay Mark Neil | $359,788 | |
| Closed | Clay Mark Neil | $289,733 | |
| Closed | Clay Mark Neil | $95,500 | |
| Closed | Clay Mark Neil | $31,648 | |
| Closed | Clay Mark Neil | $201,022 | |
| Closed | Clay Mark Neil | $198,103 | |
| Closed | Clay Mark Neil | $196,721 | |
| Previous Owner | Kimmell Jeffrey J | $142,434 |
Source: Public Records
Tax History Compared to Growth
Tax History
| Year | Tax Paid | Tax Assessment Tax Assessment Total Assessment is a certain percentage of the fair market value that is determined by local assessors to be the total taxable value of land and additions on the property. | Land | Improvement |
|---|---|---|---|---|
| 2024 | $3,999 | $42,080 | $9,910 | $32,170 |
| 2023 | $4,036 | $42,080 | $9,910 | $32,170 |
| 2022 | $2,865 | $28,260 | $6,780 | $21,480 |
| 2021 | $2,976 | $28,260 | $6,780 | $21,480 |
| 2020 | $2,839 | $27,640 | $6,450 | $21,190 |
| 2019 | $2,848 | $27,640 | $6,450 | $21,190 |
| 2018 | $2,351 | $24,230 | $5,660 | $18,570 |
| 2017 | $2,384 | $24,230 | $5,660 | $18,570 |
| 2016 | $2,180 | $21,740 | $5,180 | $16,560 |
| 2015 | $2,221 | $21,740 | $5,180 | $16,560 |
| 2014 | $1,925 | $17,780 | $5,250 | $12,530 |
Source: Public Records
Map
Nearby Homes
- 6647 Lynx Cove
- 7083 Leopard Dr
- 10538 Tiger Chase
- 10345 Lions Heart
- 10388 Lions Path
- 6440 Serengeti Cir
- 10531 Lieter Place
- 7067 Gray Fox Ct
- 6502 Shea Place
- 10441 Carriage Club Dr
- 10529 Dacre Place
- 10456 Carriage Club Dr
- 10511 Jaguar Glen
- 10487 Panther Trace
- 6242 Shea Place
- 10383 Erin Place
- 9983 Cottoncreek Dr
- 7659 Lebrun Ct
- 10773 Cougar Ridge
- 10524 Eby Cir
- 10411 Lynx Bay
- 10403 Lynx Bay
- 10419 Lynx Bay
- 10435 Lynx Bay
- 6635 Lionshead Pkwy
- 6625 Lionshead Pkwy
- 6645 Lionshead Pkwy
- 6615 Lionshead Pkwy
- 10392 Lone Lynx
- 10408 Lone Lynx
- 10451 Lynx Bay
- 10384 Lone Lynx
- 10416 Lone Lynx
- 10469 Lynx Bay
- 10424 Lone Lynx
- 10420 Lynx Bay
- 10404 Lynx Bay
- 10412 Lynx Bay
- 10376 Lone Lynx
- 10426 Lynx Bay