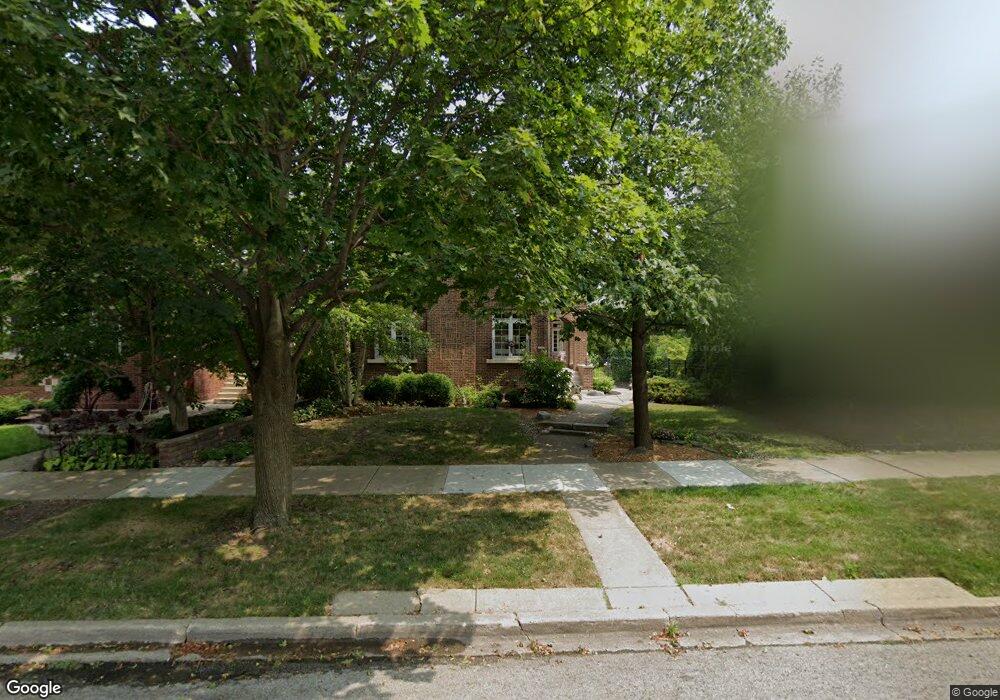
10411 S Hamilton Ave Chicago, IL 60643
Beverly NeighborhoodEstimated Value: $527,000 - $709,000
4
Beds
3
Baths
2,200
Sq Ft
$271/Sq Ft
Est. Value
About This Home
This home is located at 10411 S Hamilton Ave, Chicago, IL 60643 and is currently estimated at $597,053, approximately $271 per square foot. 10411 S Hamilton Ave is a home located in Cook County with nearby schools including Sutherland Elementary School, Morgan Park High School, and St Barnabas Elementary School.
Ownership History
Date
Name
Owned For
Owner Type
Purchase Details
Closed on
Aug 6, 2019
Sold by
Lowery Elizabeth A
Bought by
Shields Donald J and Arvia Rose M
Current Estimated Value
Home Financials for this Owner
Home Financials are based on the most recent Mortgage that was taken out on this home.
Original Mortgage
$412,000
Outstanding Balance
$364,808
Interest Rate
4.25%
Mortgage Type
New Conventional
Estimated Equity
$232,245
Purchase Details
Closed on
Mar 29, 2016
Sold by
Hechem Sanaa C
Bought by
Lowery Elizabeth A
Home Financials for this Owner
Home Financials are based on the most recent Mortgage that was taken out on this home.
Original Mortgage
$322,000
Interest Rate
3.62%
Mortgage Type
New Conventional
Purchase Details
Closed on
Jul 21, 1999
Sold by
Ghali Samy W
Bought by
Hachen Sanaa C
Home Financials for this Owner
Home Financials are based on the most recent Mortgage that was taken out on this home.
Original Mortgage
$199,200
Interest Rate
7.93%
Create a Home Valuation Report for This Property
The Home Valuation Report is an in-depth analysis detailing your home's value as well as a comparison with similar homes in the area
Home Values in the Area
Average Home Value in this Area
Purchase History
| Date | Buyer | Sale Price | Title Company |
|---|---|---|---|
| Shields Donald J | $515,000 | None Available | |
| Lowery Elizabeth A | $460,000 | None Available | |
| Hachen Sanaa C | $249,000 | -- |
Source: Public Records
Mortgage History
| Date | Status | Borrower | Loan Amount |
|---|---|---|---|
| Open | Shields Donald J | $412,000 | |
| Previous Owner | Lowery Elizabeth A | $322,000 | |
| Previous Owner | Hachen Sanaa C | $199,200 |
Source: Public Records
Tax History Compared to Growth
Tax History
| Year | Tax Paid | Tax Assessment Tax Assessment Total Assessment is a certain percentage of the fair market value that is determined by local assessors to be the total taxable value of land and additions on the property. | Land | Improvement |
|---|---|---|---|---|
| 2024 | $7,547 | $44,875 | $9,455 | $35,420 |
| 2023 | $7,340 | $39,000 | $7,625 | $31,375 |
| 2022 | $7,340 | $39,000 | $7,625 | $31,375 |
| 2021 | $7,865 | $39,000 | $7,625 | $31,375 |
| 2020 | $6,081 | $27,228 | $6,100 | $21,128 |
| 2019 | $5,271 | $29,596 | $6,100 | $23,496 |
| 2018 | $5,181 | $29,596 | $6,100 | $23,496 |
| 2017 | $6,683 | $34,354 | $5,490 | $28,864 |
| 2016 | $6,828 | $36,507 | $5,490 | $31,017 |
| 2015 | $6,224 | $36,507 | $5,490 | $31,017 |
| 2014 | $5,253 | $30,808 | $5,185 | $25,623 |
| 2013 | $6,063 | $35,888 | $5,185 | $30,703 |
Source: Public Records
Map
Nearby Homes
- 10337 S Hamilton Ave
- 10226 S Hoyne Ave
- 10247 S Bell Ave
- 10606 S Longwood Dr
- 10628 S Longwood Dr
- 10425 S Hale Ave Unit 2A
- 10433 S Hale Ave Unit 1A
- 10127 S Hoyne Ave
- 10537 S Hale Ave Unit 1W
- 10601 S Hale Ave
- 10640 S Walden Pkwy
- 10057 S Bell Ave
- 1863 W 107th St Unit E
- 1724 W 105th St
- 2320 W 101st St
- 10200 S Artesian Ave
- 1700 W 105th St
- 2023 W 108th Place
- 1726 W 106th St
- 1918 W 108th Place
- 10415 S Hamilton Ave
- 10409 S Hamilton Ave
- 10425 S Hamilton Ave
- 10401 S Hamilton Ave
- 10410 S Hoyne Ave
- 10431 S Hamilton Ave
- 10422 S Hoyne Ave
- 10400 S Hoyne Ave
- 10400 S Hoyne Ave
- 10416 S Hamilton Ave
- 10412 S Hamilton Ave
- 10430 S Hoyne Ave
- 10435 S Hamilton Ave
- 10420 S Hamilton Ave
- 10406 S Hamilton Ave
- 10428 S Hamilton Ave
- 10400 S Hamilton Ave
- 10439 S Hamilton Ave
- 10357 S Hamilton Ave
- 10436 S Hoyne Ave