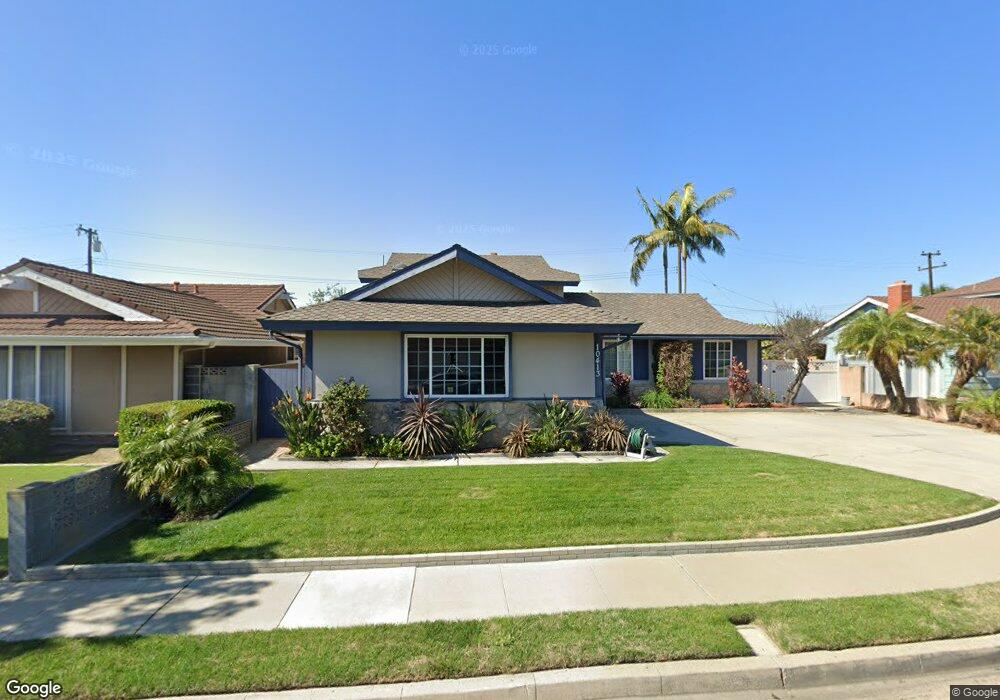
10413 Cary Cir Cypress, CA 90630
Estimated Value: $1,177,819 - $1,310,000
3
Beds
3
Baths
1,954
Sq Ft
$624/Sq Ft
Est. Value
About This Home
This home is located at 10413 Cary Cir, Cypress, CA 90630 and is currently estimated at $1,219,455, approximately $624 per square foot. 10413 Cary Cir is a home located in Orange County with nearby schools including Los Alamitos Elementary School, Jack L. Weaver Elementary School, and Sharon Christa Mcauliffe Middle School.
Ownership History
Date
Name
Owned For
Owner Type
Purchase Details
Closed on
Apr 1, 2019
Sold by
Graves Steven and Graves Cheryl
Bought by
Graves Family Trust
Current Estimated Value
Purchase Details
Closed on
Jul 22, 2009
Sold by
Graves Steven and Graves Cheryl
Bought by
Graves Steven and Graves Cheryl
Home Financials for this Owner
Home Financials are based on the most recent Mortgage that was taken out on this home.
Original Mortgage
$350,000
Outstanding Balance
$231,661
Interest Rate
5.59%
Mortgage Type
New Conventional
Estimated Equity
$987,794
Purchase Details
Closed on
Mar 16, 1996
Sold by
Federal Home Loan Mortgage Corporation
Bought by
Graves Steve and Graves Cheryl
Home Financials for this Owner
Home Financials are based on the most recent Mortgage that was taken out on this home.
Original Mortgage
$184,950
Interest Rate
7.05%
Purchase Details
Closed on
Dec 14, 1995
Sold by
Warren John Edward and Warren Cindy Louise
Bought by
Federal Home Loan Mortgage Corporation
Create a Home Valuation Report for This Property
The Home Valuation Report is an in-depth analysis detailing your home's value as well as a comparison with similar homes in the area
Home Values in the Area
Average Home Value in this Area
Purchase History
| Date | Buyer | Sale Price | Title Company |
|---|---|---|---|
| Graves Family Trust | -- | None Available | |
| Graves Steven | -- | Cctn | |
| Graves Steve | $195,000 | Fidelity National Title Ins | |
| Federal Home Loan Mortgage Corporation | $189,900 | First Southwestern Title Co |
Source: Public Records
Mortgage History
| Date | Status | Borrower | Loan Amount |
|---|---|---|---|
| Open | Graves Steven | $350,000 | |
| Closed | Graves Steve | $184,950 |
Source: Public Records
Tax History Compared to Growth
Tax History
| Year | Tax Paid | Tax Assessment Tax Assessment Total Assessment is a certain percentage of the fair market value that is determined by local assessors to be the total taxable value of land and additions on the property. | Land | Improvement |
|---|---|---|---|---|
| 2025 | $4,168 | $361,858 | $185,963 | $175,895 |
| 2024 | $4,168 | $354,763 | $182,316 | $172,447 |
| 2023 | $4,070 | $347,807 | $178,741 | $169,066 |
| 2022 | $4,019 | $340,988 | $175,237 | $165,751 |
| 2021 | $3,966 | $334,302 | $171,801 | $162,501 |
| 2020 | $3,949 | $330,875 | $170,040 | $160,835 |
| 2019 | $3,840 | $324,388 | $166,706 | $157,682 |
| 2018 | $3,787 | $318,028 | $163,437 | $154,591 |
| 2017 | $3,659 | $311,793 | $160,233 | $151,560 |
| 2016 | $3,627 | $305,680 | $157,091 | $148,589 |
| 2015 | $3,599 | $301,089 | $154,731 | $146,358 |
| 2014 | $3,410 | $295,192 | $151,700 | $143,492 |
Source: Public Records
Map
Nearby Homes
- 10232 Hialeah Dr
- 10446 Julie Beth Cir
- 10202 Aqueduct Dr
- 4671 Myra Ave
- 10292 Ethel St
- 4233 Larwin Ave
- 4043 Larwin Ave
- 9841 Via Sonoma
- 9824 Via Sonoma
- 10947 Carrillo Ct
- 4412 Green Ave
- 10461 El Dorado Way
- 4003 Via Encinas
- 4326 Via Verde
- 4461 Farquhar Ave
- 11091 Ranger Dr
- 4790 Montefino Dr
- 3621 Halbrite Ave
- 3878 Howard Ave Unit 8
- 3802 Howard Ave
- 10423 Cary Cir
- 10403 Cary Cir
- 10433 Cary Cir
- 10414 Cary Cir
- 4402 Marion Ave
- 4412 Marion Ave
- 10424 Cary Cir
- 10404 Cary Cir
- 4382 Marion Ave
- 4422 Marion Ave
- 10434 Cary Cir
- 4412 Patricia Dr
- 4372 Marion Ave
- 4442 Marion Ave
- 10415 Beaver Cir
- 4362 Marion Ave
- 10425 Beaver Cir
- 10405 Beaver Cir
- 4422 Patricia Dr
- 4452 Marion Ave