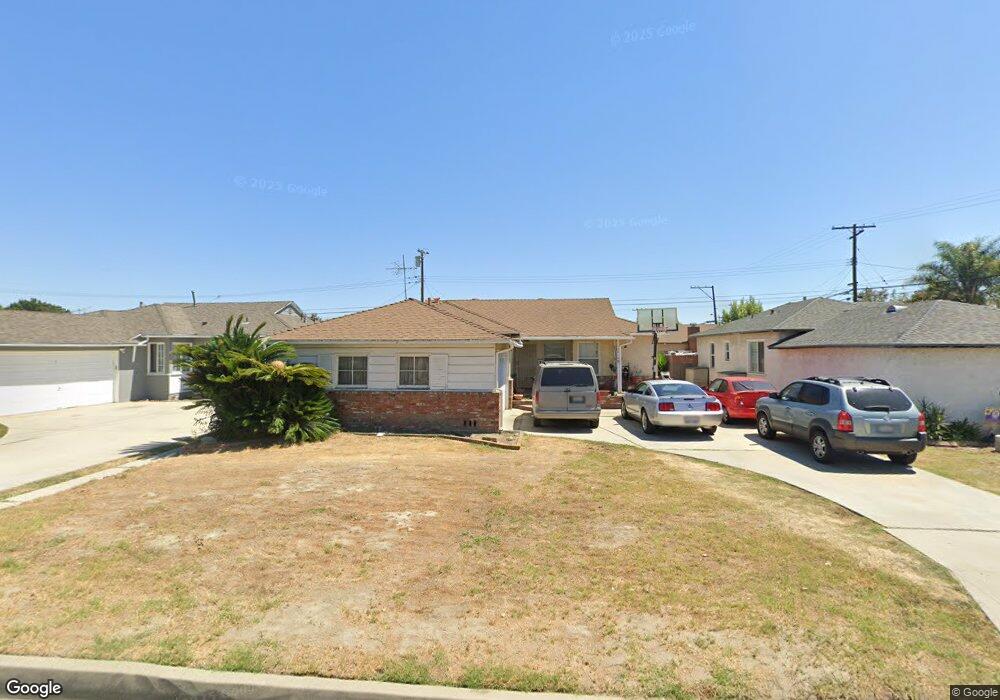
10414 Nichols St Bellflower, CA 90706
Estimated Value: $807,002 - $905,000
3
Beds
2
Baths
1,427
Sq Ft
$600/Sq Ft
Est. Value
About This Home
This home is located at 10414 Nichols St, Bellflower, CA 90706 and is currently estimated at $856,501, approximately $600 per square foot. 10414 Nichols St is a home located in Los Angeles County with nearby schools including Ernie Pyle Elementary School, Bellflower High School, and Southland Christian Academy.
Ownership History
Date
Name
Owned For
Owner Type
Purchase Details
Closed on
Apr 4, 2005
Sold by
Baja Melvin M
Bought by
Baja Melvin M and Gascon Baja Loretto Laura Marie E
Current Estimated Value
Purchase Details
Closed on
Oct 7, 2004
Sold by
Gascon Baja Loretto Laura Marie E
Bought by
Baja Melvin M
Home Financials for this Owner
Home Financials are based on the most recent Mortgage that was taken out on this home.
Original Mortgage
$280,000
Outstanding Balance
$138,391
Interest Rate
5.74%
Mortgage Type
New Conventional
Estimated Equity
$718,110
Purchase Details
Closed on
Aug 4, 2003
Sold by
Baja Melvin M
Bought by
Baja Melvin M and Gascon Loretto Laura Marie E
Home Financials for this Owner
Home Financials are based on the most recent Mortgage that was taken out on this home.
Original Mortgage
$257,250
Interest Rate
5.5%
Mortgage Type
Purchase Money Mortgage
Purchase Details
Closed on
Apr 8, 1998
Sold by
Knickman Dorothy M
Bought by
Bain Dorothy M and Knickman Dorothy M
Create a Home Valuation Report for This Property
The Home Valuation Report is an in-depth analysis detailing your home's value as well as a comparison with similar homes in the area
Home Values in the Area
Average Home Value in this Area
Purchase History
| Date | Buyer | Sale Price | Title Company |
|---|---|---|---|
| Baja Melvin M | -- | Orange Coast Title Company | |
| Baja Melvin M | -- | Stewart Title | |
| Baja Melvin M | -- | Chicago Title Co | |
| Baja Melvin M | $343,000 | Chicago Title Co | |
| Bain Dorothy M | -- | Old Republic Title Company |
Source: Public Records
Mortgage History
| Date | Status | Borrower | Loan Amount |
|---|---|---|---|
| Open | Baja Melvin M | $280,000 | |
| Previous Owner | Baja Melvin M | $257,250 |
Source: Public Records
Tax History Compared to Growth
Tax History
| Year | Tax Paid | Tax Assessment Tax Assessment Total Assessment is a certain percentage of the fair market value that is determined by local assessors to be the total taxable value of land and additions on the property. | Land | Improvement |
|---|---|---|---|---|
| 2025 | $5,871 | $487,655 | $327,714 | $159,941 |
| 2024 | $5,871 | $478,094 | $321,289 | $156,805 |
| 2023 | $5,635 | $468,721 | $314,990 | $153,731 |
| 2022 | $5,532 | $459,531 | $308,814 | $150,717 |
| 2021 | $5,417 | $450,521 | $302,759 | $147,762 |
| 2019 | $5,274 | $437,160 | $293,780 | $143,380 |
| 2018 | $5,070 | $428,589 | $288,020 | $140,569 |
| 2016 | $4,862 | $411,948 | $276,837 | $135,111 |
| 2015 | $4,760 | $405,761 | $272,679 | $133,082 |
| 2014 | $4,377 | $369,000 | $248,000 | $121,000 |
Source: Public Records
Map
Nearby Homes
- 10446 Highdale St
- 15343 Carfax Ave
- 10349 Mapledale St
- 10347 Mapledale St
- 14831 Domart Ave
- 10525 Somerset Blvd Unit 40
- 10525 Somerset Blvd Unit 45
- 14325 Mcnab Ave Unit 24
- 14837 Piuma Ave
- 15531 Woodruff Ave
- 10121 1/5 Washington St
- 15539 Woodruff Ave Unit 17
- 14426 Piuma Ave
- 15355 Eucalyptus Ave
- 14508 Dumont Ave
- 14002 Bergen Ave
- 15129 Cabell Ave
- 14004 Edgewater Dr
- 14065 Bayside Dr
- 16232 California Ave
- 10418 Nichols St
- 10408 Nichols St
- 10415 Fairton St
- 10424 Nichols St
- 10402 Nichols St
- 10409 Fairton St
- 10425 Fairton St
- 10403 Fairton St
- 10413 Nichols St
- 10430 Nichols St
- 10419 Nichols St
- 10409 Nichols St
- 10425 Nichols St
- 10431 Fairton St
- 10403 Nichols St
- 10434 Nichols St
- 10431 Nichols St
- 10435 Fairton St
- 10435 Nichols St
- 10414 Fairton St