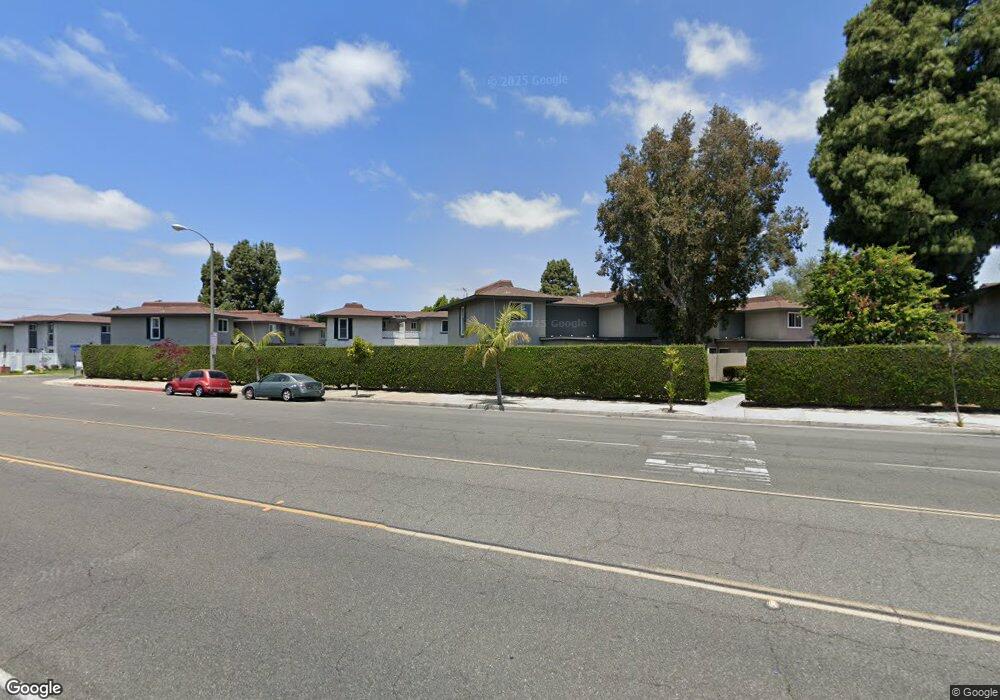
10414 Rutgers Ct Cypress, CA 90630
Estimated Value: $626,000 - $678,000
2
Beds
2
Baths
1,032
Sq Ft
$630/Sq Ft
Est. Value
About This Home
This home is located at 10414 Rutgers Ct, Cypress, CA 90630 and is currently estimated at $650,603, approximately $630 per square foot. 10414 Rutgers Ct is a home located in Orange County with nearby schools including Los Alamitos Elementary School, Jack L. Weaver Elementary School, and Sharon Christa Mcauliffe Middle School.
Ownership History
Date
Name
Owned For
Owner Type
Purchase Details
Closed on
Nov 5, 2002
Sold by
Shank Mark S
Bought by
Shank Mark S
Current Estimated Value
Purchase Details
Closed on
Sep 18, 2000
Sold by
Dianna Rivera and Bailey Dianna Bailey
Bought by
Shank Mark S
Home Financials for this Owner
Home Financials are based on the most recent Mortgage that was taken out on this home.
Original Mortgage
$123,600
Outstanding Balance
$44,377
Interest Rate
7.89%
Estimated Equity
$606,226
Purchase Details
Closed on
Sep 15, 2000
Sold by
Shank Nancy J
Bought by
Shank Mark S
Home Financials for this Owner
Home Financials are based on the most recent Mortgage that was taken out on this home.
Original Mortgage
$123,600
Outstanding Balance
$44,377
Interest Rate
7.89%
Estimated Equity
$606,226
Create a Home Valuation Report for This Property
The Home Valuation Report is an in-depth analysis detailing your home's value as well as a comparison with similar homes in the area
Home Values in the Area
Average Home Value in this Area
Purchase History
| Date | Buyer | Sale Price | Title Company |
|---|---|---|---|
| Shank Mark S | -- | Commonwealth Title | |
| Shank Mark S | $154,500 | North American Title Co | |
| Shank Mark S | -- | North American Title Co |
Source: Public Records
Mortgage History
| Date | Status | Borrower | Loan Amount |
|---|---|---|---|
| Open | Shank Mark S | $123,600 |
Source: Public Records
Tax History Compared to Growth
Tax History
| Year | Tax Paid | Tax Assessment Tax Assessment Total Assessment is a certain percentage of the fair market value that is determined by local assessors to be the total taxable value of land and additions on the property. | Land | Improvement |
|---|---|---|---|---|
| 2025 | $3,075 | $232,797 | $167,257 | $65,540 |
| 2024 | $3,075 | $228,233 | $163,978 | $64,255 |
| 2023 | $2,996 | $223,758 | $160,762 | $62,996 |
| 2022 | $2,969 | $219,371 | $157,610 | $61,761 |
| 2021 | $2,902 | $215,070 | $154,520 | $60,550 |
| 2020 | $2,899 | $212,865 | $152,935 | $59,930 |
| 2019 | $2,800 | $208,692 | $149,937 | $58,755 |
| 2018 | $2,689 | $204,600 | $146,997 | $57,603 |
| 2017 | $2,629 | $200,589 | $144,115 | $56,474 |
| 2016 | $2,576 | $196,656 | $141,289 | $55,367 |
| 2015 | $2,540 | $193,703 | $139,167 | $54,536 |
| 2014 | $2,452 | $189,909 | $136,441 | $53,468 |
Source: Public Records
Map
Nearby Homes
- 10424 Santa Rita St
- 10455 Santa Marta St
- 10202 Aqueduct Dr
- 10144 Bloomfield Ave
- 10461 El Dorado Way
- 9824 Via Sonoma
- 4671 Myra Ave
- 10292 Ethel St
- 9686 Bloomfield Ave
- 3140 Marna Ave
- 3802 Howard Ave
- 3621 Halbrite Ave
- 3845 Farquhar Ave Unit 110
- 3845 Farquhar Ave
- 10702 Oak St
- 4326 Via Verde
- 4461 Farquhar Ave
- 10681 Oak St Unit 29
- 3645 Farquhar Ave Unit 6
- 11344 Rochelle St
- 10415 Rutgers Ct
- 10416 Rutgers Ct
- 10417 Rutgers Ct
- 10412 Rutgers Ct
- 10413 Rutgers Ct
- 10411 Rutgers Ct
- 10401 Colgate Dr
- 10410 Rutgers Ct
- 10402 Colgate Dr
- 10401 Carlyle Ct
- 10403 Colgate Dr
- 10402 Carlyle Ct
- 10404 Colgate Dr
- 10403 Carlyle Ct
- 10404 Carlyle Ct
- 10409 Rutgers Ct
- 10403 Rutgers Ct
- 10402 Rutgers Ct
- 10408 Rutgers Ct
- 10401 Rutgers Ct