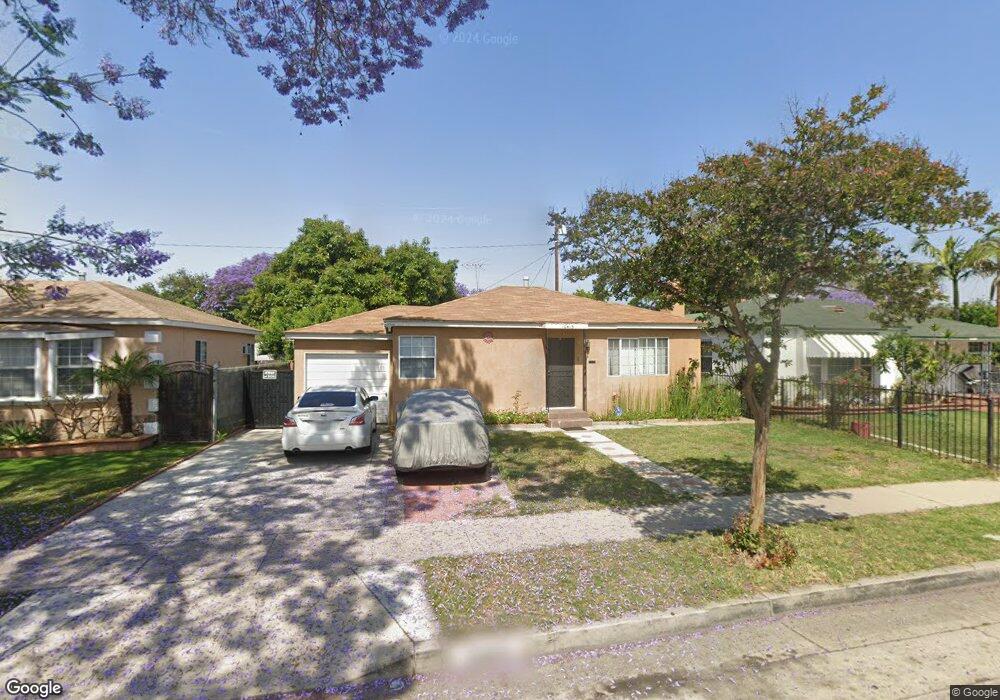
10415 Hunt Ave South Gate, CA 90280
Estimated Value: $611,878 - $700,000
2
Beds
1
Bath
837
Sq Ft
$789/Sq Ft
Est. Value
About This Home
This home is located at 10415 Hunt Ave, South Gate, CA 90280 and is currently estimated at $660,470, approximately $789 per square foot. 10415 Hunt Ave is a home located in Los Angeles County with nearby schools including Bryson Avenue Elementary School, South Gate Middle School, and Southeast Middle School.
Ownership History
Date
Name
Owned For
Owner Type
Purchase Details
Closed on
Mar 16, 2020
Sold by
Espinoza Angel Rafael Castro and Castro Angel R
Bought by
Espinoza Angel Rafael Castro and Sanchez Enedina Alvarez
Current Estimated Value
Home Financials for this Owner
Home Financials are based on the most recent Mortgage that was taken out on this home.
Original Mortgage
$96,103
Outstanding Balance
$84,951
Interest Rate
3.4%
Mortgage Type
New Conventional
Estimated Equity
$575,519
Purchase Details
Closed on
Nov 14, 1996
Sold by
Federal National Mortgage Association
Bought by
Castro Angel R and Castro Antonio E
Home Financials for this Owner
Home Financials are based on the most recent Mortgage that was taken out on this home.
Original Mortgage
$123,150
Interest Rate
7.86%
Mortgage Type
Seller Take Back
Purchase Details
Closed on
Aug 22, 1996
Sold by
Avalos Jose L and Federal National Mortgage Asso
Bought by
Federal National Mortgage Association
Create a Home Valuation Report for This Property
The Home Valuation Report is an in-depth analysis detailing your home's value as well as a comparison with similar homes in the area
Home Values in the Area
Average Home Value in this Area
Purchase History
| Date | Buyer | Sale Price | Title Company |
|---|---|---|---|
| Espinoza Angel Rafael Castro | -- | Stewart Title | |
| Castro Angel R | $127,000 | Fidelity Title | |
| Federal National Mortgage Association | $120,838 | Fidelity National Title Ins |
Source: Public Records
Mortgage History
| Date | Status | Borrower | Loan Amount |
|---|---|---|---|
| Open | Espinoza Angel Rafael Castro | $96,103 | |
| Closed | Castro Angel R | $123,150 |
Source: Public Records
Tax History Compared to Growth
Tax History
| Year | Tax Paid | Tax Assessment Tax Assessment Total Assessment is a certain percentage of the fair market value that is determined by local assessors to be the total taxable value of land and additions on the property. | Land | Improvement |
|---|---|---|---|---|
| 2025 | $3,713 | $270,451 | $186,799 | $83,652 |
| 2024 | $3,713 | $265,149 | $183,137 | $82,012 |
| 2023 | $3,651 | $259,951 | $179,547 | $80,404 |
| 2022 | $3,483 | $254,855 | $176,027 | $78,828 |
| 2021 | $3,442 | $249,859 | $172,576 | $77,283 |
| 2020 | $3,466 | $247,298 | $170,807 | $76,491 |
| 2019 | $3,336 | $242,450 | $167,458 | $74,992 |
| 2018 | $3,266 | $237,697 | $164,175 | $73,522 |
| 2017 | $3,199 | $233,037 | $160,956 | $72,081 |
| 2016 | $3,123 | $228,468 | $157,800 | $70,668 |
| 2015 | $3,074 | $225,037 | $155,430 | $69,607 |
| 2014 | $3,075 | $220,630 | $152,386 | $68,244 |
Source: Public Records
Map
Nearby Homes
- 10307 Alexander Ave
- 10891 Standard Ave
- 10933 Sampson Ave
- 10611 San Luis Ave
- 9718 Otis St
- 9714 Otis St
- 9616 Bowman Ave
- 9643 Mallison Ave
- 4032 Le Sage St
- 10240 Atlantic Ave
- 10406 San Carlos Ave
- 11267 Sampson Ave
- 9525 Bowman Ave
- 9528 Mcnerney Ave
- 9611 Mallison Ave
- 10029 San Gabriel Ave
- 11309 Annetta Ave
- 10348 California Ave
- 9219 Alexander Ave
- 10249 California Ave
- 10409 Hunt Ave
- 10421 Hunt Ave
- 10414 Bryson Ave
- 10427 Hunt Ave
- 10420 Bryson Ave
- 10408 Bryson Ave
- 10426 Bryson Ave
- 10433 Hunt Ave
- 10353 Hunt Ave
- 10412 Hunt Ave
- 10406 Hunt Ave
- 10432 Bryson Ave
- 10418 Hunt Ave
- 10352 Bryson Ave
- 10422 Hunt Ave
- 10439 Hunt Ave
- 10347 Hunt Ave
- 10438 Bryson Ave
- 10344 Hunt Ave
- 10426 Hunt Ave