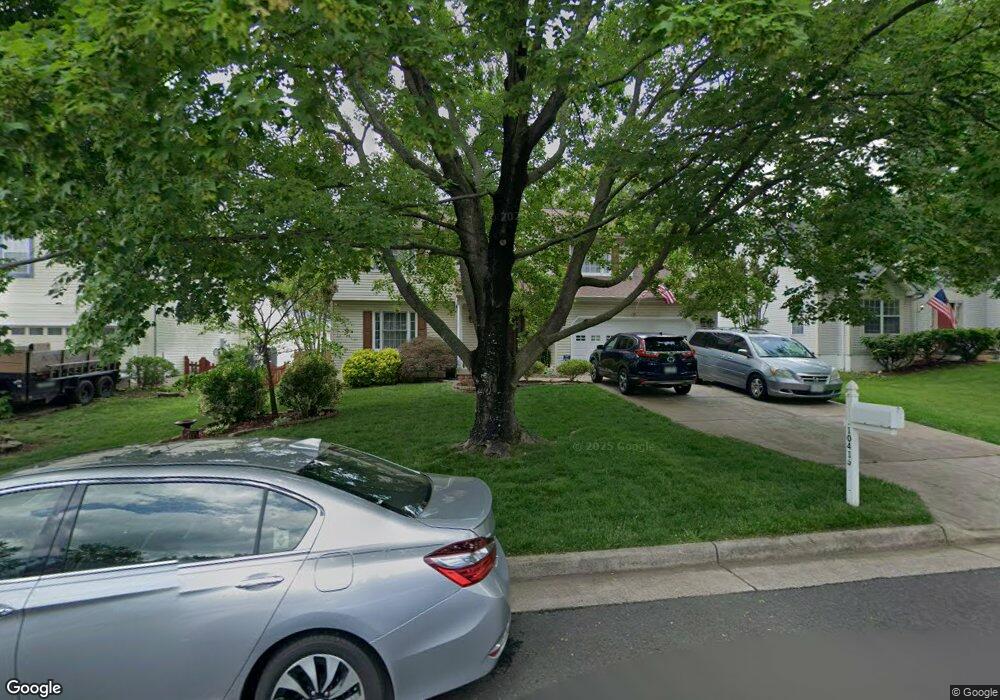
10416 Labrador Loop Manassas, VA 20112
Estimated Value: $627,782 - $649,000
4
Beds
4
Baths
2,142
Sq Ft
$296/Sq Ft
Est. Value
About This Home
This home is located at 10416 Labrador Loop, Manassas, VA 20112 and is currently estimated at $634,446, approximately $296 per square foot. 10416 Labrador Loop is a home located in Prince William County with nearby schools including Bennett Elementary School, Parkside Middle School, and Osbourn Park High School.
Ownership History
Date
Name
Owned For
Owner Type
Purchase Details
Closed on
Jul 27, 1998
Sold by
Lytikainen Carl R
Bought by
Schweich Timothy P and Schweich Ruchita M
Current Estimated Value
Home Financials for this Owner
Home Financials are based on the most recent Mortgage that was taken out on this home.
Original Mortgage
$169,900
Outstanding Balance
$35,660
Interest Rate
6.99%
Mortgage Type
New Conventional
Estimated Equity
$598,786
Purchase Details
Closed on
Mar 28, 1995
Sold by
Bank United Of Texas
Bought by
Lytikainen Carl R
Home Financials for this Owner
Home Financials are based on the most recent Mortgage that was taken out on this home.
Original Mortgage
$155,300
Interest Rate
8.78%
Purchase Details
Closed on
Feb 15, 1995
Sold by
Krishnan Thirumalai
Bought by
Bank United Of Texas Fsb
Home Financials for this Owner
Home Financials are based on the most recent Mortgage that was taken out on this home.
Original Mortgage
$155,300
Interest Rate
8.78%
Create a Home Valuation Report for This Property
The Home Valuation Report is an in-depth analysis detailing your home's value as well as a comparison with similar homes in the area
Home Values in the Area
Average Home Value in this Area
Purchase History
| Date | Buyer | Sale Price | Title Company |
|---|---|---|---|
| Schweich Timothy P | $178,900 | -- | |
| Lytikainen Carl R | $163,500 | -- | |
| Bank United Of Texas Fsb | $162,000 | -- |
Source: Public Records
Mortgage History
| Date | Status | Borrower | Loan Amount |
|---|---|---|---|
| Open | Bank United Of Texas Fsb | $169,900 | |
| Previous Owner | Bank United Of Texas Fsb | $155,300 |
Source: Public Records
Tax History
| Year | Tax Paid | Tax Assessment Tax Assessment Total Assessment is a certain percentage of the fair market value that is determined by local assessors to be the total taxable value of land and additions on the property. | Land | Improvement |
|---|---|---|---|---|
| 2025 | $4,976 | $540,300 | $159,700 | $380,600 |
| 2024 | $4,976 | $500,400 | $148,000 | $352,400 |
| 2023 | $4,979 | $478,500 | $142,300 | $336,200 |
| 2022 | $4,939 | $435,700 | $128,200 | $307,500 |
| 2021 | $4,869 | $397,500 | $116,800 | $280,700 |
| 2020 | $5,974 | $385,400 | $115,300 | $270,100 |
| 2019 | $5,689 | $367,000 | $110,100 | $256,900 |
| 2018 | $4,314 | $357,300 | $108,600 | $248,700 |
| 2017 | $4,326 | $349,400 | $106,400 | $243,000 |
| 2016 | $4,116 | $335,300 | $101,300 | $234,000 |
| 2015 | $4,042 | $333,900 | $101,100 | $232,800 |
| 2014 | $4,042 | $322,100 | $98,500 | $223,600 |
Source: Public Records
Map
Nearby Homes
- 9360 Caspian Way Unit 202
- 10275 Fountain Cir Unit 201
- 10260 Whitworth Ln
- 9210 Caspian Way Unit 302
- 10273 Fountain Cir Unit 202
- 10499 Godwin Dr
- 10501 Godwin Dr
- 9131 Karlo St
- 10391 Aragon Ct
- 9204 Charleston Dr Unit 202
- 9204 Charleston Dr Unit 206
- 9200 Charleston Dr Unit 301
- 9202 Charleston Dr Unit 406
- 9202 Charleston Dr Unit 405
- 10416 Monterosa Place
- 9610 Normanton Way
- 9395 Cloverhill Ct
- 8898 Englewood Farms Dr
- 9403 Cloverhill Ct
- 8910 Bradley Manor Place
- 10414 Labrador Loop
- 10418 Labrador Loop
- 10412 Labrador Loop
- 10420 Labrador Loop
- 10422 Labrador Loop
- 10410 Labrador Loop
- 10415 Labrador Loop
- 10417 Labrador Loop
- 10404 Labrador Loop
- 10428 Labrador Loop
- 10426 Labrador Loop
- 10406 Labrador Loop
- 10423 Labrador Loop
- 10424 Labrador Loop
- 10408 Labrador Loop
- 10432 Labrador Loop
- 10409 Labrador Loop
- 10429 Labrador Loop
- 10436 Labrador Loop
Your Personal Tour Guide
Ask me questions while you tour the home.