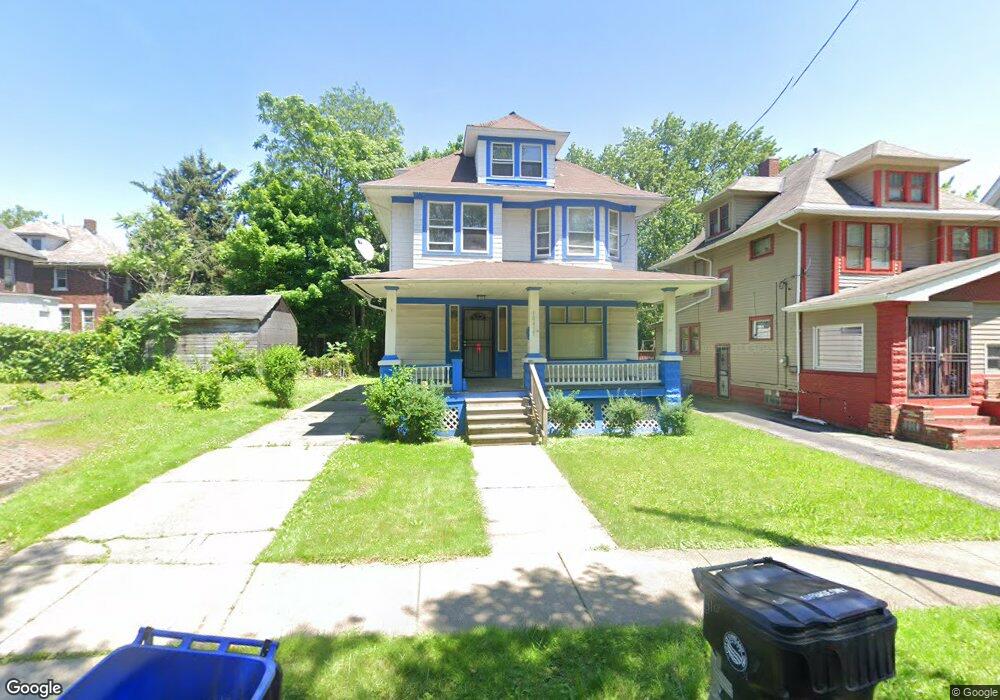
10417 Elmarge Ave Cleveland, OH 44105
Union-Miles Park NeighborhoodEstimated Value: $76,000 - $88,000
4
Beds
1
Bath
1,501
Sq Ft
$54/Sq Ft
Est. Value
About This Home
This home is located at 10417 Elmarge Ave, Cleveland, OH 44105 and is currently estimated at $80,554, approximately $53 per square foot. 10417 Elmarge Ave is a home located in Cuyahoga County with nearby schools including Andrew J. Rickoff School, Anton Grdina School, and Adlai Stevenson School.
Ownership History
Date
Name
Owned For
Owner Type
Purchase Details
Closed on
Jul 18, 2011
Sold by
Fannie Mae
Bought by
Nickerson Richard
Current Estimated Value
Purchase Details
Closed on
Oct 21, 2010
Sold by
Brown John E
Bought by
Federal National Mortgage Association
Purchase Details
Closed on
Jun 4, 1999
Sold by
Estate Of Joe Brown Jr
Bought by
Brown Lelia M
Purchase Details
Closed on
Apr 14, 1987
Sold by
Haggins Isaac
Bought by
Brown Joe
Purchase Details
Closed on
Mar 4, 1987
Sold by
Finkelstein Viadimir
Bought by
Haggins Isaac
Purchase Details
Closed on
Feb 23, 1987
Bought by
Finkelstein Viadimir
Purchase Details
Closed on
Aug 27, 1986
Bought by
Secretary Of Hud
Purchase Details
Closed on
Oct 23, 1980
Bought by
Leflore Robert
Purchase Details
Closed on
Jan 26, 1979
Bought by
Secy Of H U D
Purchase Details
Closed on
Jan 1, 1975
Bought by
White Fred and White Lillie
Create a Home Valuation Report for This Property
The Home Valuation Report is an in-depth analysis detailing your home's value as well as a comparison with similar homes in the area
Home Values in the Area
Average Home Value in this Area
Purchase History
| Date | Buyer | Sale Price | Title Company |
|---|---|---|---|
| Nickerson Richard | $3,900 | Accutitle Agency | |
| Federal National Mortgage Association | $10,000 | None Available | |
| Brown Lelia M | -- | -- | |
| Brown Joe | $34,400 | -- | |
| Haggins Isaac | $9,300 | -- | |
| Finkelstein Viadimir | -- | -- | |
| Secretary Of Hud | -- | -- | |
| Lomas & Nettleton Co | -- | -- | |
| Leflore Robert | -- | -- | |
| Secy Of H U D | -- | -- | |
| Federal National | $6,000 | -- | |
| White Fred | -- | -- |
Source: Public Records
Tax History Compared to Growth
Tax History
| Year | Tax Paid | Tax Assessment Tax Assessment Total Assessment is a certain percentage of the fair market value that is determined by local assessors to be the total taxable value of land and additions on the property. | Land | Improvement |
|---|---|---|---|---|
| 2024 | $1,101 | $16,450 | $4,235 | $12,215 |
| 2023 | $736 | $9,490 | $2,070 | $7,420 |
| 2022 | $732 | $9,490 | $2,070 | $7,420 |
| 2021 | $725 | $9,490 | $2,070 | $7,420 |
| 2020 | $724 | $8,190 | $1,790 | $6,410 |
| 2019 | $671 | $23,400 | $5,100 | $18,300 |
| 2018 | $669 | $8,190 | $1,790 | $6,410 |
| 2017 | $545 | $6,450 | $1,510 | $4,940 |
| 2016 | $541 | $6,450 | $1,510 | $4,940 |
| 2015 | $1,365 | $6,450 | $1,510 | $4,940 |
| 2014 | $1,365 | $7,570 | $1,790 | $5,780 |
Source: Public Records
Map
Nearby Homes
- 4137 E 102nd St
- 4127 E 100th St
- 4155 E 111th St
- 4221 E 112th St
- 4119 E 111th St
- 4139 E 97th St
- 9607 Pratt Ave
- 4139 E 95th St
- 4154 E 95th St
- 4259 E 94th St
- 4112 E 114th St
- 4251 E 114th St
- 4234 E 116th St
- 10225 Avon Ave
- 4219 E 116th St
- 11624 Miles Ave
- 4313 E 116th St
- 11704 Robertson Ave
- 10201 Dove Ave
- 10414 Nelson Ave
- 10421 Elmarge Ave
- 10423 Elmarge Ave
- 10406 Miles Ave
- 10410 Miles Ave
- 10402 Miles Ave
- 10420 Miles Ave
- 10511 Elmarge Ave
- 10515 Elmarge Ave
- 10523 Elmarge Ave
- 10505 Elmarge Ave
- 10502 Miles Ave
- 10416 Elmarge Ave
- 10412 Elmarge Ave
- 10506 Miles Ave
- 10422 Elmarge Ave
- 10531 Elmarge Ave
- 10525 Elmarge Ave
- 10512 Miles Ave
- 10535 Elmarge Ave
- 10430 Elmarge Ave