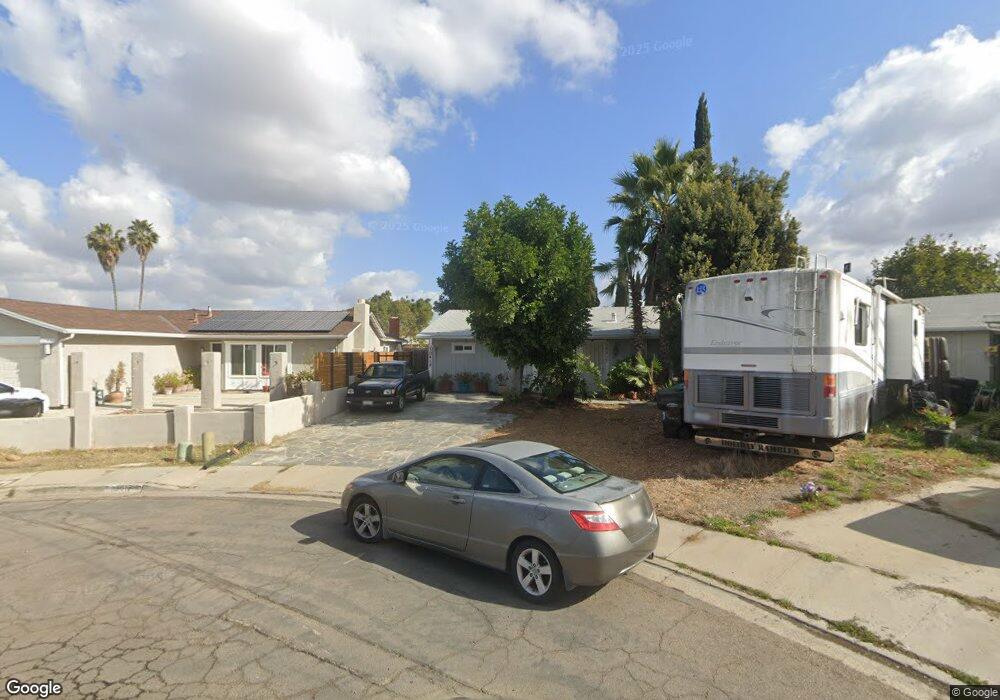
10417 Hebrides Cir San Diego, CA 92126
Mira Mesa NeighborhoodEstimated Value: $910,166 - $984,000
3
Beds
2
Baths
968
Sq Ft
$983/Sq Ft
Est. Value
About This Home
This home is located at 10417 Hebrides Cir, San Diego, CA 92126 and is currently estimated at $951,292, approximately $982 per square foot. 10417 Hebrides Cir is a home located in San Diego County with nearby schools including Mason Elementary School, Wangenheim Middle School, and Mira Mesa High School.
Ownership History
Date
Name
Owned For
Owner Type
Purchase Details
Closed on
Dec 17, 2020
Sold by
King David K
Bought by
King David Kevin and 2020 David Kevin
Current Estimated Value
Purchase Details
Closed on
Jan 26, 2007
Sold by
King David K
Bought by
King David K
Home Financials for this Owner
Home Financials are based on the most recent Mortgage that was taken out on this home.
Original Mortgage
$92,000
Outstanding Balance
$54,951
Interest Rate
6.11%
Mortgage Type
New Conventional
Estimated Equity
$896,341
Purchase Details
Closed on
Feb 18, 2003
Sold by
King Cornelia
Bought by
King David K
Home Financials for this Owner
Home Financials are based on the most recent Mortgage that was taken out on this home.
Original Mortgage
$229,500
Outstanding Balance
$97,859
Interest Rate
5.89%
Mortgage Type
Stand Alone First
Estimated Equity
$853,433
Purchase Details
Closed on
Feb 18, 1999
Sold by
Hume Family Trust 11-22-91 and Robert P
Bought by
King David K and King Cornelia
Home Financials for this Owner
Home Financials are based on the most recent Mortgage that was taken out on this home.
Original Mortgage
$101,600
Interest Rate
6.78%
Create a Home Valuation Report for This Property
The Home Valuation Report is an in-depth analysis detailing your home's value as well as a comparison with similar homes in the area
Home Values in the Area
Average Home Value in this Area
Purchase History
| Date | Buyer | Sale Price | Title Company |
|---|---|---|---|
| King David Kevin | -- | None Available | |
| King David K | -- | None Available | |
| King David K | -- | Fidelity National Title Co | |
| King David K | $127,000 | New Century Title Company |
Source: Public Records
Mortgage History
| Date | Status | Borrower | Loan Amount |
|---|---|---|---|
| Open | King David K | $92,000 | |
| Open | King David K | $229,500 | |
| Closed | King David K | $101,600 |
Source: Public Records
Tax History Compared to Growth
Tax History
| Year | Tax Paid | Tax Assessment Tax Assessment Total Assessment is a certain percentage of the fair market value that is determined by local assessors to be the total taxable value of land and additions on the property. | Land | Improvement |
|---|---|---|---|---|
| 2025 | $2,800 | $235,278 | $90,546 | $144,732 |
| 2024 | $2,800 | $230,666 | $88,771 | $141,895 |
| 2023 | $2,735 | $226,144 | $87,031 | $139,113 |
| 2022 | $2,660 | $221,711 | $85,325 | $136,386 |
| 2021 | $2,640 | $217,364 | $83,652 | $133,712 |
| 2020 | $2,607 | $215,136 | $82,795 | $132,341 |
| 2019 | $2,559 | $210,919 | $81,172 | $129,747 |
| 2018 | $2,393 | $206,784 | $79,581 | $127,203 |
| 2017 | $2,331 | $202,730 | $78,021 | $124,709 |
| 2016 | $2,291 | $198,756 | $76,492 | $122,264 |
| 2015 | $2,257 | $195,772 | $75,344 | $120,428 |
| 2014 | $2,221 | $191,938 | $73,869 | $118,069 |
Source: Public Records
Map
Nearby Homes
- 8516 Flanders Dr
- 10265 Eagle Rock Ave
- 10573 Caminito Flores
- 8670 New Salem St Unit 106
- 10422 Londonderry Ave
- 14331 Montano Way
- 14341 Montano Way
- 14659 Dunleer Way
- 14633 Dunleer Way
- 14665 Dunleer Way
- 14641 Dunleer Way
- 14312 Montano Way
- 8650 New Salem St Unit 27
- 8644 New Salem St Unit 6
- 8654 New Salem St Unit 44
- 10174 Camino Ruiz Unit 46
- 10166 Camino Ruiz Unit 32
- 10582 Caminito Glenellen
- 8488 New Salem St
- 8476 New Salem St Unit 77
- 10423 Hebrides Cir
- 10411 Hebrides Cir
- 10370 Baron Dr
- 10380 Baron Dr
- 10360 Baron Dr
- 10390 Baron Dr
- 10405 Hebrides Cir
- 8595 Hebrides Dr
- 8583 Hebrides Dr
- 8607 Hebrides Dr
- 10350 Baron Dr
- 10410 Baron Dr
- 10404 Hebrides Cir
- 8615 Hebrides Dr
- 10338 Baron Dr
- 8571 Hebrides Dr
- 10412 Hebrides Cir
- 8620 Pagoda Way
- 10420 Hebrides Cir
- 8606 Pagoda Way