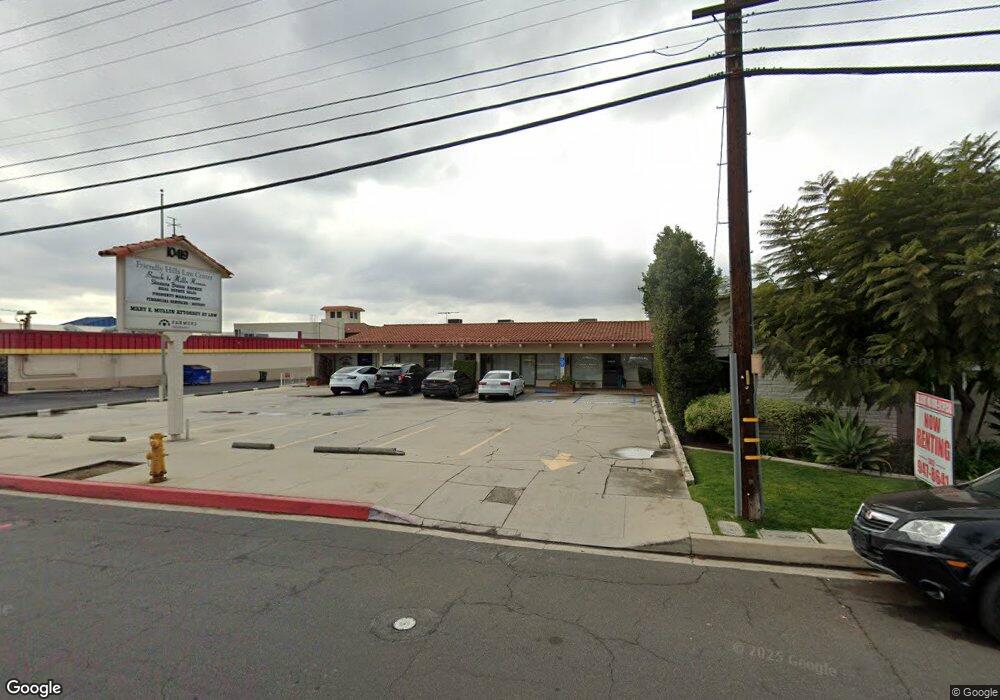
10419 Bogardus Ave Unit 150 Whittier, CA 90603
South Whittier NeighborhoodEstimated Value: $1,130,365
--
Bed
--
Bath
4,158
Sq Ft
$272/Sq Ft
Est. Value
About This Home
This home is located at 10419 Bogardus Ave Unit 150, Whittier, CA 90603 and is currently estimated at $1,130,365, approximately $271 per square foot. 10419 Bogardus Ave Unit 150 is a home located in Los Angeles County with nearby schools including Macy Elementary School, Rancho-Starbuck Intermediate School, and La Habra High School.
Ownership History
Date
Name
Owned For
Owner Type
Purchase Details
Closed on
Apr 18, 2008
Sold by
Haendiges Sylvia L
Bought by
Haendiges Robert L
Current Estimated Value
Purchase Details
Closed on
Mar 24, 1997
Sold by
Campion Kenneth G and Campion Susan K
Bought by
Haendiges Robert L and 10419 Bogardus Ave Trust
Home Financials for this Owner
Home Financials are based on the most recent Mortgage that was taken out on this home.
Original Mortgage
$50,000
Outstanding Balance
$6,128
Interest Rate
7.86%
Mortgage Type
Commercial
Estimated Equity
$1,124,237
Purchase Details
Closed on
Mar 23, 1997
Sold by
Pacific West Assn Of Realtors Inc
Bought by
Campion Kenneth G and Campion Susan K
Home Financials for this Owner
Home Financials are based on the most recent Mortgage that was taken out on this home.
Original Mortgage
$50,000
Outstanding Balance
$6,128
Interest Rate
7.86%
Mortgage Type
Commercial
Estimated Equity
$1,124,237
Create a Home Valuation Report for This Property
The Home Valuation Report is an in-depth analysis detailing your home's value as well as a comparison with similar homes in the area
Home Values in the Area
Average Home Value in this Area
Purchase History
| Date | Buyer | Sale Price | Title Company |
|---|---|---|---|
| Haendiges Robert L | -- | None Available | |
| Haendiges Robert L | -- | -- | |
| Campion Kenneth G | $201,500 | -- |
Source: Public Records
Mortgage History
| Date | Status | Borrower | Loan Amount |
|---|---|---|---|
| Open | Haendiges Robert L | $50,000 | |
| Open | Campion Kenneth G | $151,125 | |
| Closed | Haendiges Robert L | $50,000 |
Source: Public Records
Tax History Compared to Growth
Tax History
| Year | Tax Paid | Tax Assessment Tax Assessment Total Assessment is a certain percentage of the fair market value that is determined by local assessors to be the total taxable value of land and additions on the property. | Land | Improvement |
|---|---|---|---|---|
| 2025 | $5,033 | $328,158 | $95,592 | $232,566 |
| 2024 | $5,033 | $321,724 | $93,718 | $228,006 |
| 2023 | $4,944 | $315,417 | $91,881 | $223,536 |
| 2022 | $4,897 | $309,233 | $90,080 | $219,153 |
| 2021 | $4,772 | $303,170 | $88,314 | $214,856 |
| 2019 | $4,667 | $294,180 | $85,696 | $208,484 |
| 2018 | $4,268 | $288,413 | $84,016 | $204,397 |
| 2016 | $4,073 | $277,215 | $80,754 | $196,461 |
| 2015 | $3,904 | $273,051 | $79,541 | $193,510 |
| 2014 | $3,869 | $267,703 | $77,983 | $189,720 |
Source: Public Records
Map
Nearby Homes
- 10418 Bogardus Ave Unit 4
- 16046 Gables Loop
- 16164 Leffco Rd
- 10303 Pounds Ave
- 16121 Lisco St
- 15975 Graceldo Ln
- 16540 Whittier Blvd
- 10931 Groveside Ave
- 10930 Groveland Ave
- 15914 Lashburn St
- 1436 La Riata Dr
- 2611 Gregory Ln
- 16428 Whittier Blvd Unit 2
- 0 Cloister Dr Unit OC24116252
- 2401 Canfield Dr
- 16635 Monte Oro Dr
- 16040 Leffingwell Rd Unit 76
- 16040 Leffingwell Rd Unit 103
- 16040 Leffingwell Rd Unit 92
- 2311 Canfield Dr
- 10419 Bogardus Ave Unit B
- 10407 Bogardus Ave
- 10418 Bogardus Ave
- 10418 Bogardus Ave Unit 3
- 10418 Bogardus Ave Unit 2
- 10418 Bogardus Ave Unit 1
- 16202 Shady Valley Ln
- 16150 Shady Valley Ln
- 10420 Bogardus Ave Unit 3
- 10420 Bogardus Ave
- 10420 Bogardus Ave Unit 2
- 10420 Bogardus Ave Unit 1
- 16156 Shady Valley Ln
- 16142 Shady Valley Ln
- 10434 Bogardus Ave
- 16136 Shady Valley Ln
- 16208 Shady Valley Ln
- 10436 Bogardus Ave
- 10432 Bogardus Ave
- 16128 Shady Valley Ln