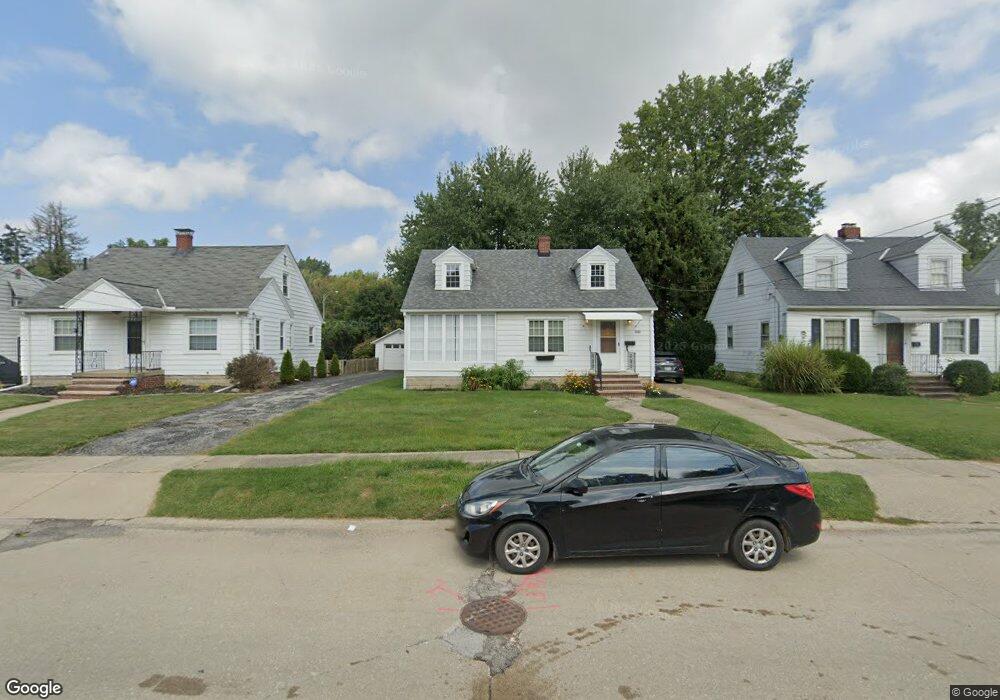
1042 Bell Ct Elyria, OH 44035
Estimated Value: $92,000 - $134,000
3
Beds
2
Baths
952
Sq Ft
$127/Sq Ft
Est. Value
About This Home
This home is located at 1042 Bell Ct, Elyria, OH 44035 and is currently estimated at $121,086, approximately $127 per square foot. 1042 Bell Ct is a home located in Lorain County with nearby schools including Westwood Middle School, Elyria High School, and St Mary Elementary School.
Ownership History
Date
Name
Owned For
Owner Type
Purchase Details
Closed on
Aug 6, 2010
Sold by
Fannie Mae
Bought by
Hall Stephanie G
Current Estimated Value
Home Financials for this Owner
Home Financials are based on the most recent Mortgage that was taken out on this home.
Original Mortgage
$63,653
Outstanding Balance
$41,974
Interest Rate
4.49%
Mortgage Type
FHA
Estimated Equity
$79,112
Purchase Details
Closed on
Mar 11, 2010
Sold by
Crawford Scott S
Bought by
Federal National Mortgage Association
Purchase Details
Closed on
Sep 10, 1999
Sold by
Weber Tamara A and Goad Tamara A
Bought by
Crawford Scott S
Create a Home Valuation Report for This Property
The Home Valuation Report is an in-depth analysis detailing your home's value as well as a comparison with similar homes in the area
Home Values in the Area
Average Home Value in this Area
Purchase History
| Date | Buyer | Sale Price | Title Company |
|---|---|---|---|
| Hall Stephanie G | $44,000 | Accutitle Agency Inc | |
| Federal National Mortgage Association | $44,000 | None Available | |
| Crawford Scott S | $31,700 | Landsel Title Agency |
Source: Public Records
Mortgage History
| Date | Status | Borrower | Loan Amount |
|---|---|---|---|
| Open | Hall Stephanie G | $63,653 |
Source: Public Records
Tax History
| Year | Tax Paid | Tax Assessment Tax Assessment Total Assessment is a certain percentage of the fair market value that is determined by local assessors to be the total taxable value of land and additions on the property. | Land | Improvement |
|---|---|---|---|---|
| 2024 | $2,031 | $41,234 | $7,641 | $33,593 |
| 2023 | $1,883 | $32,998 | $8,239 | $24,759 |
| 2022 | $1,861 | $32,998 | $8,239 | $24,759 |
| 2021 | $1,873 | $32,998 | $8,239 | $24,759 |
| 2020 | $1,768 | $27,550 | $6,880 | $20,670 |
| 2019 | $1,717 | $27,550 | $6,880 | $20,670 |
| 2018 | $1,720 | $27,550 | $6,880 | $20,670 |
| 2017 | $1,724 | $26,470 | $7,260 | $19,210 |
| 2016 | $1,702 | $26,470 | $7,260 | $19,210 |
| 2015 | $1,597 | $26,470 | $7,260 | $19,210 |
| 2014 | $1,661 | $27,860 | $7,640 | $20,220 |
| 2013 | $1,647 | $27,860 | $7,640 | $20,220 |
Source: Public Records
Map
Nearby Homes
Your Personal Tour Guide
Ask me questions while you tour the home.