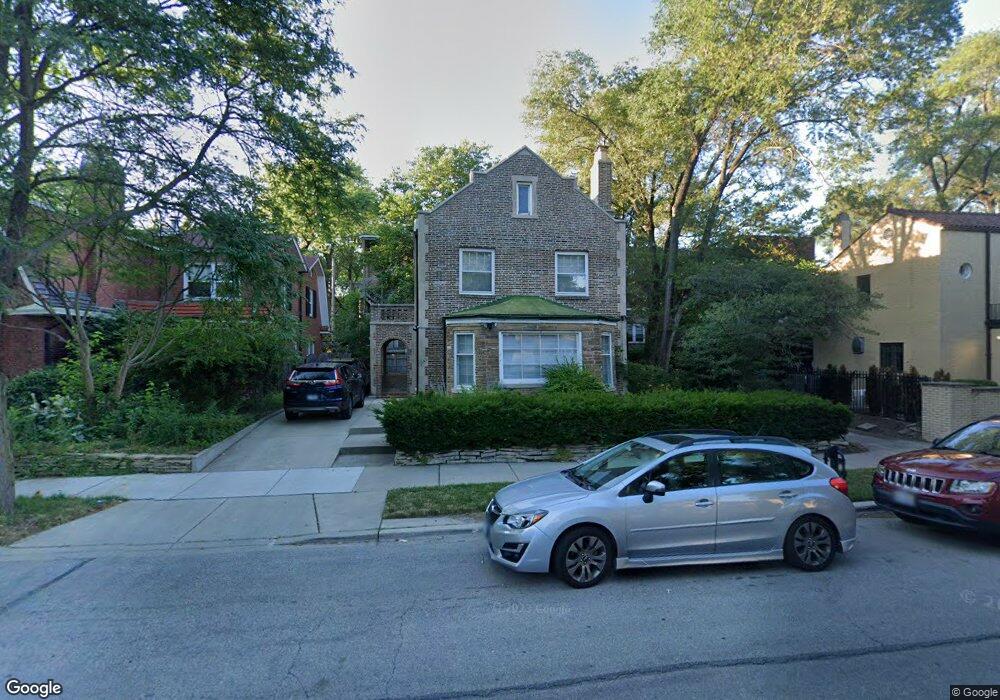
1042 E 48th St Chicago, IL 60615
Kenwood NeighborhoodEstimated Value: $837,000 - $1,119,611
4
Beds
3
Baths
2,966
Sq Ft
$327/Sq Ft
Est. Value
About This Home
This home is located at 1042 E 48th St, Chicago, IL 60615 and is currently estimated at $971,153, approximately $327 per square foot. 1042 E 48th St is a home located in Cook County with nearby schools including Reavis Elementary Math & Science Specialty School, Kenwood Academy High School, and The UChicago Charter School - North Kenwood/Oakland.
Ownership History
Date
Name
Owned For
Owner Type
Purchase Details
Closed on
Sep 30, 2020
Sold by
Lewis Paul B and Lewis Sheri H
Bought by
Lewis Paul B
Current Estimated Value
Purchase Details
Closed on
Aug 31, 2007
Sold by
Hough Donald H and Hough Jane S
Bought by
Lewis Paul B and Lewis Sheri H
Home Financials for this Owner
Home Financials are based on the most recent Mortgage that was taken out on this home.
Original Mortgage
$300,000
Outstanding Balance
$187,017
Interest Rate
6.63%
Mortgage Type
Unknown
Estimated Equity
$784,136
Purchase Details
Closed on
Jan 8, 1999
Sold by
Crawford Ioanna
Bought by
Hough Donald H and Hough Jane S
Home Financials for this Owner
Home Financials are based on the most recent Mortgage that was taken out on this home.
Original Mortgage
$240,000
Interest Rate
6.79%
Purchase Details
Closed on
Nov 13, 1995
Sold by
Crawford Andrew W
Bought by
Crawford Ioanna K
Create a Home Valuation Report for This Property
The Home Valuation Report is an in-depth analysis detailing your home's value as well as a comparison with similar homes in the area
Home Values in the Area
Average Home Value in this Area
Purchase History
| Date | Buyer | Sale Price | Title Company |
|---|---|---|---|
| Lewis Paul B | -- | Attorney | |
| Lewis Paul B | $739,500 | Ct | |
| Hough Donald H | $335,000 | Chicago Title Insurance Co | |
| Crawford Ioanna K | -- | Chicago Title Insurance Co |
Source: Public Records
Mortgage History
| Date | Status | Borrower | Loan Amount |
|---|---|---|---|
| Open | Lewis Paul B | $300,000 | |
| Previous Owner | Hough Donald H | $240,000 |
Source: Public Records
Tax History
| Year | Tax Paid | Tax Assessment Tax Assessment Total Assessment is a certain percentage of the fair market value that is determined by local assessors to be the total taxable value of land and additions on the property. | Land | Improvement |
|---|---|---|---|---|
| 2025 | $13,299 | $90,719 | $34,255 | $56,464 |
| 2024 | $13,299 | $90,719 | $34,255 | $56,464 |
| 2023 | $14,887 | $66,124 | $27,625 | $38,499 |
| 2022 | $14,887 | $75,802 | $27,625 | $48,177 |
| 2021 | $14,573 | $75,801 | $27,625 | $48,176 |
| 2020 | $16,354 | $76,516 | $22,100 | $54,416 |
| 2019 | $16,021 | $83,170 | $22,100 | $61,070 |
| 2018 | $15,750 | $83,170 | $22,100 | $61,070 |
| 2017 | $14,340 | $69,989 | $18,232 | $51,757 |
| 2016 | $15,722 | $80,993 | $18,232 | $62,761 |
| 2015 | $15,241 | $85,797 | $18,232 | $67,565 |
| 2014 | $8,592 | $48,877 | $14,917 | $33,960 |
| 2013 | $9,706 | $55,996 | $14,917 | $41,079 |
Source: Public Records
Map
Nearby Homes
- 4730 S Greenwood Ave
- 1034 E 47th St Unit 1W
- 4721 S Ingleside Ave
- 4740 S Ingleside Ave Unit 2N
- 4721 S Woodlawn Ave Unit E
- 4701 S Woodlawn Ave
- 4959 S Greenwood Ave
- 1024 E 46th St Unit 2W
- 829 E 48th St Unit D
- 4553 S Ellis Ave
- 1151 E 46th St
- 4801 S Kimbark Ave
- 4933 S Woodlawn Ave
- 928 E 46th St
- 835 E 49th St Unit 3
- 4537 S Drexel Blvd Unit 503
- 4510 S Greenwood Ave Unit 2
- 4529 S Drexel Blvd Unit 452912
- 4527 S Drexel Blvd Unit 1W
- 4525 S Drexel Blvd Unit 3W
- 1036 E 48th St
- 4748 S Greenwood Ave Unit 3W
- 4748 S Greenwood Ave Unit 1W
- 4756 S Greenwood Ave
- 4750 S Greenwood Ave
- 4740-4748 S Greenwood Ave
- 4744 S Greenwood Ave Unit 2N
- 4740 S Greenwood Ave Unit 2E
- 4740 S Greenwood Ave Unit 3E
- 4740 S Greenwood Ave
- 4742 S Greenwood Ave Unit 1E
- 4742 S Greenwood Ave Unit 2E
- 4742 S Greenwood Ave Unit 3W
- 1030 E 48th St
- 1026 E 48th St
- 4800 S Greenwood Ave
- 1039 E 48th St
- 1020 E 48th St
- 4728 S Greenwood Ave
- 4812 S Greenwood Ave
Your Personal Tour Guide
Ask me questions while you tour the home.