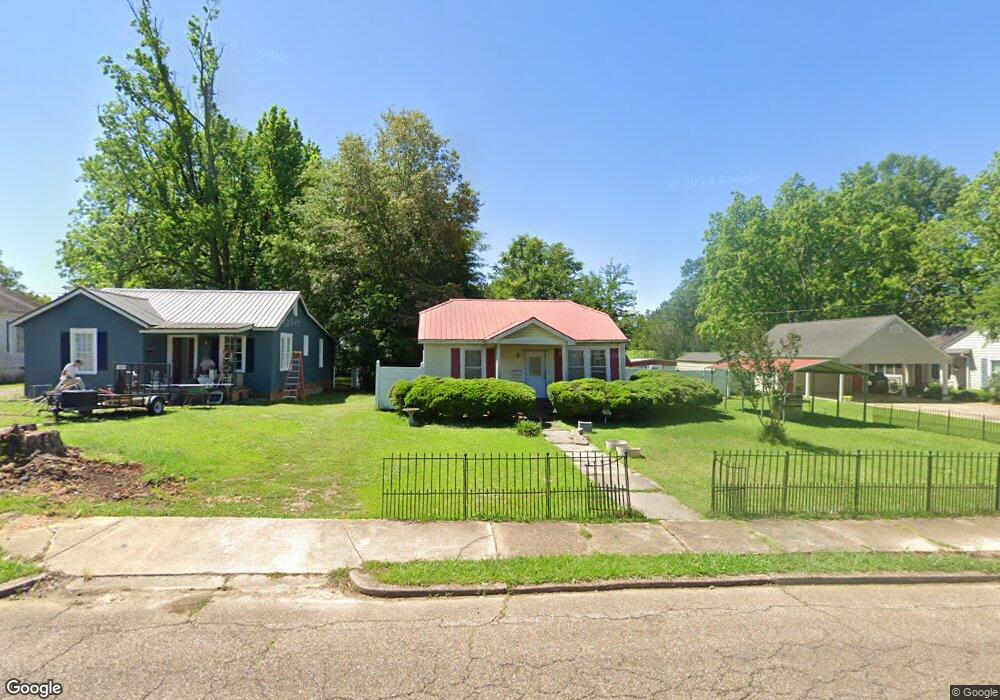
1042 E Westbrook St West Point, MS 39773
Estimated Value: $85,000 - $94,676
2
Beds
--
Bath
1,143
Sq Ft
$80/Sq Ft
Est. Value
About This Home
This home is located at 1042 E Westbrook St, West Point, MS 39773 and is currently estimated at $90,919, approximately $79 per square foot. 1042 E Westbrook St is a home located in Clay County with nearby schools including East Side Elementary School, West Clay Elementary School, and Church Hill Elementary School.
Ownership History
Date
Name
Owned For
Owner Type
Purchase Details
Closed on
Aug 12, 2024
Sold by
Walker James
Bought by
Transformed Properties Llc
Current Estimated Value
Home Financials for this Owner
Home Financials are based on the most recent Mortgage that was taken out on this home.
Original Mortgage
$112,800
Outstanding Balance
$111,003
Interest Rate
6.86%
Mortgage Type
Credit Line Revolving
Estimated Equity
-$20,084
Purchase Details
Closed on
Dec 13, 2018
Sold by
Mcclure John B
Bought by
Walker James
Create a Home Valuation Report for This Property
The Home Valuation Report is an in-depth analysis detailing your home's value as well as a comparison with similar homes in the area
Purchase History
| Date | Buyer | Sale Price | Title Company |
|---|---|---|---|
| Transformed Properties Llc | -- | None Listed On Document | |
| Transformed Properties Llc | -- | None Listed On Document | |
| Walker James | -- | -- |
Source: Public Records
Mortgage History
| Date | Status | Borrower | Loan Amount |
|---|---|---|---|
| Open | Transformed Properties Llc | $112,800 | |
| Closed | Transformed Properties Llc | $112,800 |
Source: Public Records
Tax History
| Year | Tax Paid | Tax Assessment Tax Assessment Total Assessment is a certain percentage of the fair market value that is determined by local assessors to be the total taxable value of land and additions on the property. | Land | Improvement |
|---|---|---|---|---|
| 2025 | $499 | $9,208 | $2,712 | $6,496 |
| 2024 | $499 | $9,208 | $2,712 | $6,496 |
| 2023 | $1,232 | $8,230 | $2,712 | $5,518 |
| 2022 | $188 | $5,487 | $1,808 | $3,679 |
| 2021 | $187 | $5,487 | $1,808 | $3,679 |
| 2020 | $187 | $5,487 | $1,808 | $3,679 |
| 2019 | $171 | $5,453 | $1,808 | $3,645 |
| 2018 | $159 | $5,453 | $1,808 | $3,645 |
| 2017 | $159 | $5,453 | $1,808 | $3,645 |
| 2016 | $147 | $5,418 | $1,808 | $3,610 |
| 2015 | $145 | $5,020 | $1,808 | $3,212 |
| 2014 | $323 | $5,020 | $1,808 | $3,212 |
| 2013 | $323 | $5,020 | $1,808 | $3,212 |
Source: Public Records
Map
Nearby Homes
- 341 Mccord St
- 913 E Westbrook St
- 228 Mccord St
- 551 E Westbrook St
- 26596 E Main St
- 105 Converse Dr
- 27045 E Main St
- 480 E Westbrook St
- 507 S Eshman Ave
- 472 S Eshman Ave
- 26852 E Main St
- 1046 E Brame Ave
- 405 S Eshman Ave
- 278 Converse Dr
- 44 Torbert Dr
- 238 Calhoun St
- 26788 E Main St
- 329 Converse Dr
- 761 E Morrow St
- 15 David St
- 1048 E Westbrook St
- 1031 E Westbrook St
- 1030 E Westbrook St
- 1054 E Westbrook St
- 1025 E Westbrook St
- 1045 E Westbrook St
- 1037 E Westbrook St
- 1058 E Westbrook St
- 742 E Westbrook St
- 1017 E Westbrook St
- 1020 E Westbrook St
- 1055 E Westbrook St
- 1007 E Westbrook St
- 404 Miller Ave
- 1001 E Westbrook St
- 1038 E Broad St
- 442 Miller Ave
- 1028 E Broad St
- 1059 E Westbrook St
- 1046 E Broad St
Your Personal Tour Guide
Ask me questions while you tour the home.