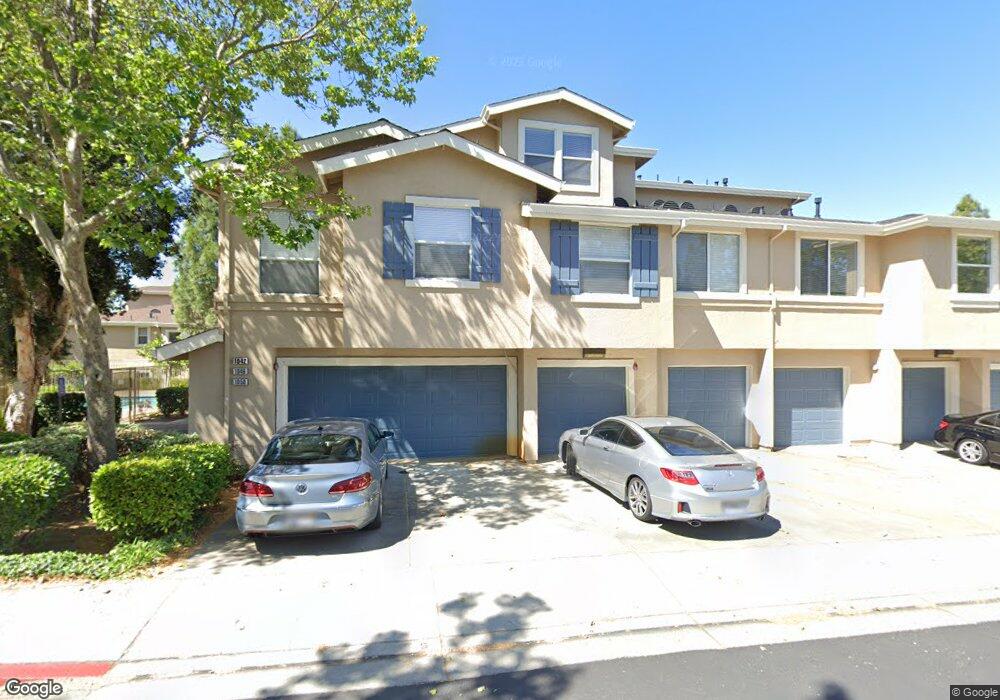
1042 Esparanza Way San Jose, CA 95138
Basking Ridge NeighborhoodEstimated Value: $862,145 - $1,006,000
2
Beds
3
Baths
1,291
Sq Ft
$711/Sq Ft
Est. Value
About This Home
This home is located at 1042 Esparanza Way, San Jose, CA 95138 and is currently estimated at $917,536, approximately $710 per square foot. 1042 Esparanza Way is a home located in Santa Clara County with nearby schools including Rita Ledesma Elementary School, Bernal Intermediate School, and Oak Grove High School.
Ownership History
Date
Name
Owned For
Owner Type
Purchase Details
Closed on
Nov 2, 2020
Sold by
Nola Rosemarie
Bought by
Nola Rosemarie Ann and Rosemarie Nola Revocable Trust
Current Estimated Value
Purchase Details
Closed on
Oct 10, 2020
Sold by
Nola Ann
Bought by
Nola Rosemarie
Purchase Details
Closed on
Jan 23, 2019
Sold by
Nola Rosemarie
Bought by
Nola Ann and Nola Rosemarie
Home Financials for this Owner
Home Financials are based on the most recent Mortgage that was taken out on this home.
Original Mortgage
$265,000
Outstanding Balance
$232,989
Interest Rate
4.6%
Mortgage Type
New Conventional
Estimated Equity
$684,547
Purchase Details
Closed on
Jun 19, 2000
Sold by
Borgerson Gregory R and Borgerson Cherie Marquez
Bought by
Nola Rosemarie
Home Financials for this Owner
Home Financials are based on the most recent Mortgage that was taken out on this home.
Original Mortgage
$307,200
Interest Rate
8.08%
Purchase Details
Closed on
Jul 16, 1998
Sold by
Shea Homes Ltd Partnership
Bought by
Borgerson Gregory Roger and Borgerson Cherie Marquez
Home Financials for this Owner
Home Financials are based on the most recent Mortgage that was taken out on this home.
Original Mortgage
$193,750
Interest Rate
6.91%
Create a Home Valuation Report for This Property
The Home Valuation Report is an in-depth analysis detailing your home's value as well as a comparison with similar homes in the area
Home Values in the Area
Average Home Value in this Area
Purchase History
| Date | Buyer | Sale Price | Title Company |
|---|---|---|---|
| Nola Rosemarie Ann | -- | None Available | |
| Nola Rosemarie | -- | None Available | |
| Nola Ann | $132,500 | First American Title | |
| Nola Rosemarie | $384,000 | Alliance Title Company | |
| Borgerson Gregory Roger | $242,500 | Financial Title Company |
Source: Public Records
Mortgage History
| Date | Status | Borrower | Loan Amount |
|---|---|---|---|
| Open | Nola Ann | $265,000 | |
| Previous Owner | Nola Rosemarie | $307,200 | |
| Previous Owner | Borgerson Gregory Roger | $193,750 | |
| Closed | Borgerson Gregory Roger | $36,300 |
Source: Public Records
Tax History Compared to Growth
Tax History
| Year | Tax Paid | Tax Assessment Tax Assessment Total Assessment is a certain percentage of the fair market value that is determined by local assessors to be the total taxable value of land and additions on the property. | Land | Improvement |
|---|---|---|---|---|
| 2025 | $7,743 | $590,179 | $184,427 | $405,752 |
| 2024 | $7,743 | $578,608 | $180,811 | $397,797 |
| 2023 | $7,635 | $567,264 | $177,266 | $389,998 |
| 2022 | $7,598 | $556,142 | $173,791 | $382,351 |
| 2021 | $7,514 | $545,238 | $170,384 | $374,854 |
| 2020 | $7,399 | $539,648 | $168,637 | $371,011 |
| 2019 | $7,336 | $529,068 | $165,331 | $363,737 |
| 2018 | $7,301 | $518,695 | $162,090 | $356,605 |
| 2017 | $7,210 | $508,525 | $158,912 | $349,613 |
| 2016 | $6,855 | $498,555 | $155,797 | $342,758 |
| 2015 | $6,694 | $491,067 | $153,457 | $337,610 |
| 2014 | $6,363 | $481,448 | $150,451 | $330,997 |
Source: Public Records
Map
Nearby Homes
- 1021 Chagall Way
- 1018 Niguel Ln
- 828 Monarch Ln
- 1075 Esparanza Way
- 1083 Esparanza Way
- 743 Promenade Ln
- 6130 Monterey Rd Unit 289
- 6130 Monterey Rd Unit 9
- 6130 Monterey Rd Unit 159
- 6130 Monterey Rd Unit 260
- 6130 Monterey Rd Unit 316
- 6986 Gregorich Dr Unit C
- 6978 Gregorich Dr Unit F
- 7102 Avenida Rotella
- 7237 Longhill Way
- 43 Southcreek Ct
- 7060 Via Anacapa
- 47 Avenida Espana
- 158 Southsun Ct
- 7394 Basking Ridge Ave
- 1046 Esparanza Way Unit 62
- 1038 Esparanza Way
- 1050 Esparanza Way
- 1034 Esparanza Way Unit 65
- 1030 Esparanza Way
- 1026 Esparanza Way
- 1041 Chagall Way
- 1022 Esparanza Way
- 1061 Chagall Way
- 1045 Chagall Way
- 1057 Chagall Way Unit 102
- 1057 Chagall Way
- 1037 Chagall Way
- 1049 Chagall Way
- 1018 Esparanza Way Unit 73
- 1065 Chagall Way
- 1053 Chagall Way Unit 101
- 1033 Chagall Way
- 1031 Esparanza Way
- 1051 Esparanza Way Unit 26