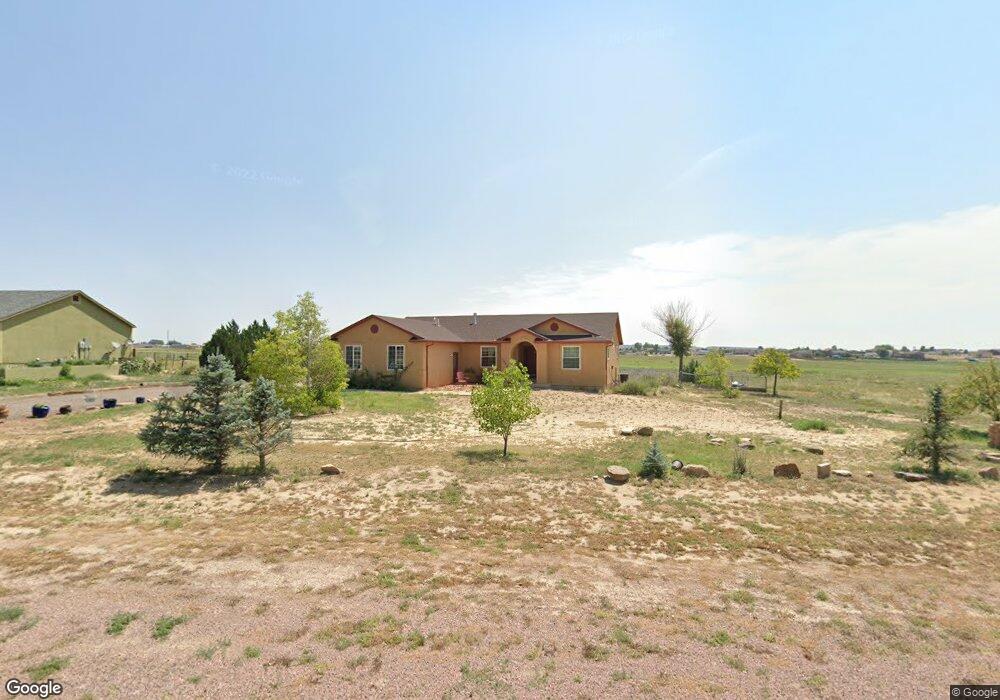
1042 S Avenida Del Oro E Pueblo, CO 81007
Estimated Value: $415,244 - $485,000
3
Beds
2
Baths
1,896
Sq Ft
$231/Sq Ft
Est. Value
About This Home
This home is located at 1042 S Avenida Del Oro E, Pueblo, CO 81007 and is currently estimated at $437,561, approximately $230 per square foot. 1042 S Avenida Del Oro E is a home located in Pueblo County with nearby schools including Cedar Ridge Elementary School, Sky View Middle School, and Pueblo West High School.
Ownership History
Date
Name
Owned For
Owner Type
Purchase Details
Closed on
Jun 2, 2009
Sold by
Lovell Musso Eileen K
Bought by
Lovell Eileen K
Current Estimated Value
Home Financials for this Owner
Home Financials are based on the most recent Mortgage that was taken out on this home.
Original Mortgage
$176,841
Outstanding Balance
$111,429
Interest Rate
4.72%
Mortgage Type
FHA
Estimated Equity
$326,132
Purchase Details
Closed on
May 5, 2000
Sold by
Cornella Brothers Inc
Bought by
Lovell Eileen K
Purchase Details
Closed on
Sep 15, 1999
Sold by
Lovell Eileen K
Bought by
Cornella Brothers Inc
Purchase Details
Closed on
Jul 30, 1999
Sold by
Ward Justine E
Bought by
Lovell Eileen K
Purchase Details
Closed on
May 18, 1993
Sold by
Real Estate Exchange Ltd
Bought by
Ward Justine E
Purchase Details
Closed on
Mar 16, 1993
Sold by
Aiken George Franklin
Bought by
Real Estate Exchange Ltd
Purchase Details
Closed on
May 19, 1980
Sold by
Lawyers Title Of Pueblo
Bought by
Aiken George Franklin
Create a Home Valuation Report for This Property
The Home Valuation Report is an in-depth analysis detailing your home's value as well as a comparison with similar homes in the area
Home Values in the Area
Average Home Value in this Area
Purchase History
| Date | Buyer | Sale Price | Title Company |
|---|---|---|---|
| Lovell Eileen K | -- | Security Title | |
| Lovell Eileen K | $166,600 | -- | |
| Cornella Brothers Inc | -- | -- | |
| Lovell Eileen K | $9,000 | -- | |
| Ward Justine E | -- | -- | |
| Real Estate Exchange Ltd | -- | -- | |
| Aiken George Franklin | -- | -- |
Source: Public Records
Mortgage History
| Date | Status | Borrower | Loan Amount |
|---|---|---|---|
| Open | Lovell Eileen K | $176,841 |
Source: Public Records
Tax History Compared to Growth
Tax History
| Year | Tax Paid | Tax Assessment Tax Assessment Total Assessment is a certain percentage of the fair market value that is determined by local assessors to be the total taxable value of land and additions on the property. | Land | Improvement |
|---|---|---|---|---|
| 2024 | $2,460 | $24,520 | -- | -- |
| 2023 | $2,489 | $28,210 | $5,030 | $23,180 |
| 2022 | $2,157 | $21,500 | $3,130 | $18,370 |
| 2021 | $2,212 | $22,120 | $3,220 | $18,900 |
| 2020 | $1,867 | $21,970 | $3,070 | $18,900 |
| 2019 | $1,862 | $18,630 | $858 | $17,772 |
| 2018 | $1,673 | $16,735 | $720 | $16,015 |
| 2017 | $1,675 | $16,735 | $720 | $16,015 |
| 2016 | $1,602 | $16,027 | $1,075 | $14,952 |
| 2015 | $1,588 | $16,027 | $1,075 | $14,952 |
| 2014 | $1,461 | $14,729 | $1,075 | $13,654 |
Source: Public Records
Map
Nearby Homes
- 1068 S Los Charros Dr
- 1340 W Oro Grande Dr
- 1127 W Mescalero Dr
- 862 S Los Mochis Way
- 925 S Camino Santiago Dr
- 1250 W Presidio Dr
- 1073 W El Esperante Dr
- 914 S Rosa Linda Dr
- 1222 S Avenida Del Oro E
- 1415 W Caida Del Sol Dr
- 1144 S Mcculloch Blvd W
- 1060 W Stallion Dr
- 1023 W El Nido Dr
- 1361 W Avenue Del Oro
- 1187 S Alta Hacienda Dr
- 1015 W Stallion Dr
- 644 S Avenida Del Oro E
- 1475 W Indian Bend Dr
- 1226 S Avenida Del Oro W
- 1537 W Calle Del Santo Dr
- 1030 S Avenida Del Oro E
- 1036 S Avendina Del Oro Dr Unit 9
- 1058 S Avenida Del Oro E Unit 4
- 1058 S Avenida Del Oro E
- 1037 S Avenida Del Oro E
- 1029 S Avenida Del Oro E
- 1045 S Avenida Del Oro E Unit 16
- 1045 S Avenida Del Oro E
- 1070 S Avenida Del Oro E
- 1055 S Avenida Del Oro E Unit 17
- 1055 S Avenida Del Oro E
- 1194 W Oro Grande Dr
- 1178 W Oro Grande Dr
- 1178 W Oro Grande Dr Unit 9
- 1069 S Avenida Del Oro E
- 1204 W Oro Grande Dr
- 1012 S Avendina Del Oro Dr Unit 7
- 1080 S Avenida Del Oro E
- 1185 W Oro Grande Dr
- 1185 W Oro Grande Dr Unit 1