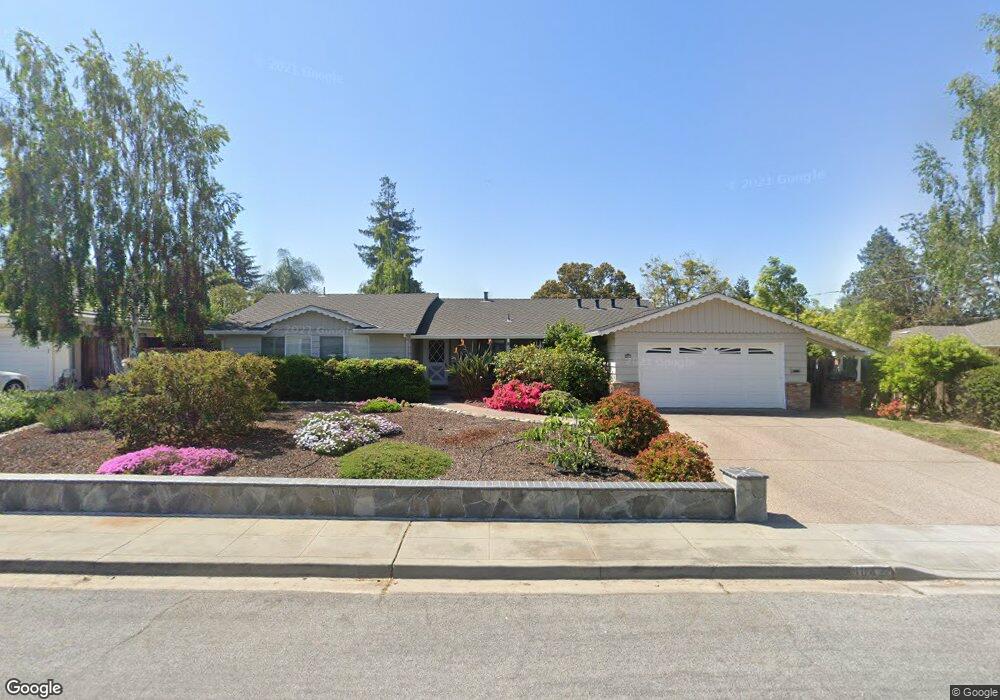
1042 Whitmer Ct Fremont, CA 94539
Mission Valley NeighborhoodEstimated Value: $2,116,000 - $2,663,000
3
Beds
3
Baths
1,835
Sq Ft
$1,307/Sq Ft
Est. Value
About This Home
This home is located at 1042 Whitmer Ct, Fremont, CA 94539 and is currently estimated at $2,398,552, approximately $1,307 per square foot. 1042 Whitmer Ct is a home located in Alameda County with nearby schools including Joshua Chadbourne Elementary School, William Hopkins Junior High School, and Mission San Jose High School.
Ownership History
Date
Name
Owned For
Owner Type
Purchase Details
Closed on
May 30, 2003
Sold by
Meng Steve and Meng Hsiu Chu C
Bought by
Meng Steve and Meng Hsiu Chu C
Current Estimated Value
Purchase Details
Closed on
Dec 15, 1999
Sold by
Graves Gerald W and Graves Helena L
Bought by
Meng Steve I C and Meng Hsiu Chu C
Home Financials for this Owner
Home Financials are based on the most recent Mortgage that was taken out on this home.
Original Mortgage
$316,000
Outstanding Balance
$98,624
Interest Rate
7.82%
Estimated Equity
$2,299,928
Purchase Details
Closed on
Jun 6, 1996
Sold by
Domerese James R and Domerese Rena L
Bought by
Graves Gerald W and Graves Helena L
Home Financials for this Owner
Home Financials are based on the most recent Mortgage that was taken out on this home.
Original Mortgage
$200,000
Interest Rate
7.96%
Purchase Details
Closed on
Nov 18, 1994
Sold by
Govea Raymond R and Govea Wenonah M
Bought by
Domerese James R and Domerese Rena L
Home Financials for this Owner
Home Financials are based on the most recent Mortgage that was taken out on this home.
Original Mortgage
$240,000
Interest Rate
4.75%
Create a Home Valuation Report for This Property
The Home Valuation Report is an in-depth analysis detailing your home's value as well as a comparison with similar homes in the area
Home Values in the Area
Average Home Value in this Area
Purchase History
| Date | Buyer | Sale Price | Title Company |
|---|---|---|---|
| Meng Steve | -- | -- | |
| Meng Steve I C | $596,000 | Chicago Title Co | |
| Graves Gerald W | $422,000 | American Title Ins Co | |
| Domerese James R | $320,000 | Chicago Title Company |
Source: Public Records
Mortgage History
| Date | Status | Borrower | Loan Amount |
|---|---|---|---|
| Open | Meng Steve I C | $316,000 | |
| Previous Owner | Graves Gerald W | $200,000 | |
| Previous Owner | Domerese James R | $240,000 |
Source: Public Records
Tax History Compared to Growth
Tax History
| Year | Tax Paid | Tax Assessment Tax Assessment Total Assessment is a certain percentage of the fair market value that is determined by local assessors to be the total taxable value of land and additions on the property. | Land | Improvement |
|---|---|---|---|---|
| 2025 | $10,920 | $908,986 | $301,230 | $614,756 |
| 2024 | $10,920 | $891,028 | $295,324 | $602,704 |
| 2023 | $10,628 | $880,423 | $289,535 | $590,888 |
| 2022 | $10,493 | $856,162 | $283,858 | $579,304 |
| 2021 | $10,234 | $839,242 | $278,294 | $567,948 |
| 2020 | $10,271 | $837,570 | $275,442 | $562,128 |
| 2019 | $10,153 | $821,150 | $270,042 | $551,108 |
| 2018 | $9,955 | $805,052 | $264,748 | $540,304 |
| 2017 | $9,705 | $789,270 | $259,558 | $529,712 |
| 2016 | $9,541 | $773,798 | $254,470 | $519,328 |
| 2015 | $9,415 | $762,176 | $250,648 | $511,528 |
| 2014 | $9,254 | $747,246 | $245,738 | $501,508 |
Source: Public Records
Map
Nearby Homes
- 1123 Farragut Dr
- 1137 Farragut Dr
- 41519 Apricot Ln
- 1962 Briscoe Terrace
- 260 Jacaranda Dr
- 41246 Mission Blvd
- 41043 Joyce Ave
- 2225 Valorie St
- 41252 Mission Blvd
- 1401 Lemos Ln
- 42329 Troyer Ave
- 41620 Beatrice St
- 41392 Beatrice St
- 42226 Camino Santa Barbara
- 2851 Finca Terrace
- 40613 Encanto Way
- 2785 Washington Blvd
- 41538 Casabella Common
- 2813 Pinnacles Terrace
- 231 Cavalo Ct
- 1028 Whitmer Ct
- 41244 Chiltern Dr
- 41238 Chiltern Dr
- 1079 Plymouth Ave
- 1047 Whitmer Ct
- 41488 Chiltern Dr
- 1033 Whitmer Ct
- 1061 Whitmer Ct
- 1014 Whitmer Ct
- 1071 Plymouth Ave
- 1019 Whitmer Ct
- 41230 Chiltern Dr
- 41241 Chiltern Dr
- 41237 Chiltern Dr
- 932 Farragut Dr
- 963 Plymouth Ave
- 41505 Chadbourne Dr
- 946 Farragut Dr
- 960 Farragut Dr
- 41224 Chiltern Dr