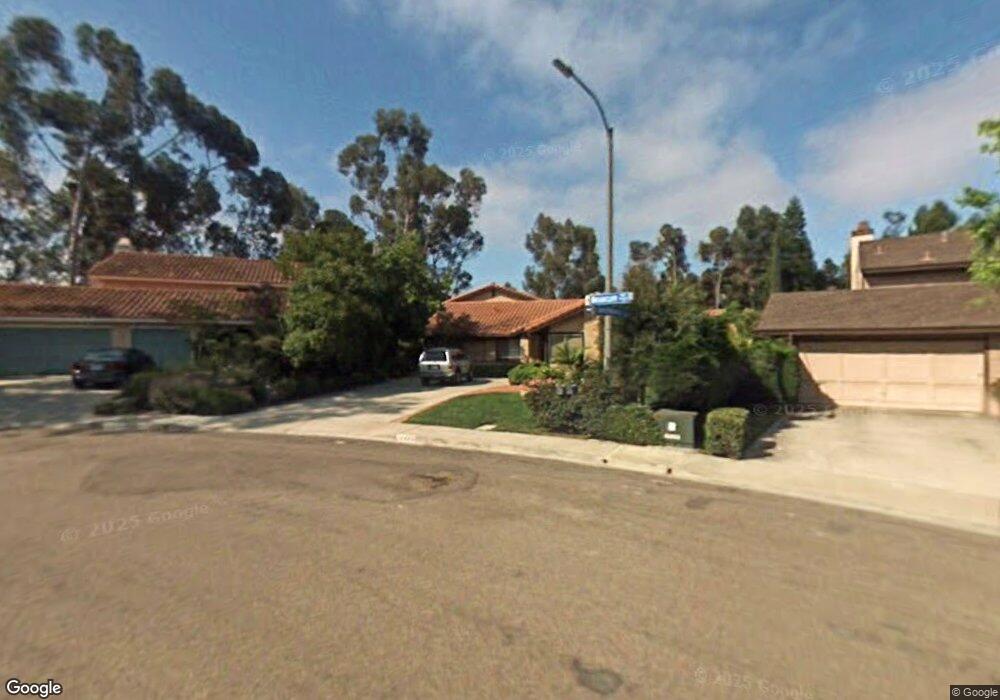
10420 Briarcliff Way San Diego, CA 92131
Scripps Ranch NeighborhoodEstimated Value: $1,821,000 - $2,121,000
5
Beds
3
Baths
3,157
Sq Ft
$631/Sq Ft
Est. Value
About This Home
This home is located at 10420 Briarcliff Way, San Diego, CA 92131 and is currently estimated at $1,991,682, approximately $630 per square foot. 10420 Briarcliff Way is a home located in San Diego County with nearby schools including Miramar Ranch Elementary School, Thurgood Marshall Middle School, and Scripps Ranch High School.
Ownership History
Date
Name
Owned For
Owner Type
Purchase Details
Closed on
Apr 8, 2019
Sold by
Mason Marjann M
Bought by
Mason Jack
Current Estimated Value
Home Financials for this Owner
Home Financials are based on the most recent Mortgage that was taken out on this home.
Original Mortgage
$784,000
Outstanding Balance
$676,109
Interest Rate
3.5%
Mortgage Type
Adjustable Rate Mortgage/ARM
Estimated Equity
$1,315,573
Purchase Details
Closed on
Mar 25, 2019
Sold by
Mason Jack
Bought by
Blonski Wojciech and Blonski Marta
Home Financials for this Owner
Home Financials are based on the most recent Mortgage that was taken out on this home.
Original Mortgage
$784,000
Outstanding Balance
$676,109
Interest Rate
3.5%
Mortgage Type
Adjustable Rate Mortgage/ARM
Estimated Equity
$1,315,573
Purchase Details
Closed on
Feb 5, 2019
Sold by
Kriebel Marilyn and Frances S Bera Trust
Bought by
Mason Jack
Home Financials for this Owner
Home Financials are based on the most recent Mortgage that was taken out on this home.
Original Mortgage
$784,000
Outstanding Balance
$676,109
Interest Rate
3.5%
Mortgage Type
Adjustable Rate Mortgage/ARM
Estimated Equity
$1,315,573
Purchase Details
Closed on
Jul 26, 2016
Sold by
Bera Frances S and Mclin Frances S
Bought by
Bera Frances S
Create a Home Valuation Report for This Property
The Home Valuation Report is an in-depth analysis detailing your home's value as well as a comparison with similar homes in the area
Home Values in the Area
Average Home Value in this Area
Purchase History
| Date | Buyer | Sale Price | Title Company |
|---|---|---|---|
| Mason Jack | -- | Corinthian Title | |
| Blonski Wojciech | $980,000 | Corinthian Title | |
| Mason Jack | -- | None Available | |
| Bera Frances S | -- | None Available |
Source: Public Records
Mortgage History
| Date | Status | Borrower | Loan Amount |
|---|---|---|---|
| Open | Blonski Wojciech | $784,000 |
Source: Public Records
Tax History Compared to Growth
Tax History
| Year | Tax Paid | Tax Assessment Tax Assessment Total Assessment is a certain percentage of the fair market value that is determined by local assessors to be the total taxable value of land and additions on the property. | Land | Improvement |
|---|---|---|---|---|
| 2025 | $14,583 | $1,190,018 | $759,981 | $430,037 |
| 2024 | $14,583 | $1,166,685 | $745,080 | $421,605 |
| 2023 | $13,932 | $1,117,339 | $730,471 | $386,868 |
| 2022 | $13,553 | $1,095,432 | $716,149 | $379,283 |
| 2021 | $13,450 | $1,073,954 | $702,107 | $371,847 |
| 2020 | $12,507 | $999,599 | $694,908 | $304,691 |
| 2019 | $11,960 | $953,700 | $663,000 | $290,700 |
| 2018 | $4,239 | $350,545 | $84,171 | $266,374 |
| 2017 | $4,136 | $343,672 | $82,521 | $261,151 |
| 2016 | $4,068 | $336,934 | $80,903 | $256,031 |
| 2015 | $4,005 | $331,874 | $79,688 | $252,186 |
| 2014 | $3,942 | $325,375 | $78,128 | $247,247 |
Source: Public Records
Map
Nearby Homes
- 10473 Crosscreek Terrace
- 10535 Arbor Park Place
- 10466 Ridgewater Ln
- 10415 Mesa Madera Dr
- 10265 Aviary Dr
- 9950 Dichondra Place
- 10616 Falcon Rim Point
- 10405 White Birch Dr
- 10831 Ironwood Rd
- 11646 La Colina Rd
- 10594 Rookwood Dr
- 11787 La Colina Rd
- 10545 Caminito Memosac
- 10280 Caminito Rio Branco
- 10565 Caminito Basswood
- 11825 Miro Cir
- 10497 Caminito Mayten
- 10447 Caminito Banyon
- 10374 Caminito Banyon Unit U140
- 11856 Miro Cir
- 10430 Briarcliff Way
- 10410 Briarcliff Way
- 1140 Southridge Way
- 10435 Brooktree Terrace
- 10425 Brooktree Terrace
- 10440 Briarcliff Way
- 10445 Brooktree Terrace
- 11111 Southridge Way
- 10455 Brooktree Terrace
- 11110 Southridge Way
- 11075 Briarcliff Dr
- 11065 Briarcliff Dr
- 11120 Southridge Way
- 10424 Alderbranch Point
- 10420 Alderbranch Point
- 11111 Briarcliff Dr
- 11055 Briarcliff Dr
- 10414 Alderbranch Point
- 10434 Brooktree Terrace
- 11130 Southridge Way