
Landlord's Agent in 2025
Jackie McBride
Perfect Pad Realty, LLC
(260) 450-3071
33 Total Sales
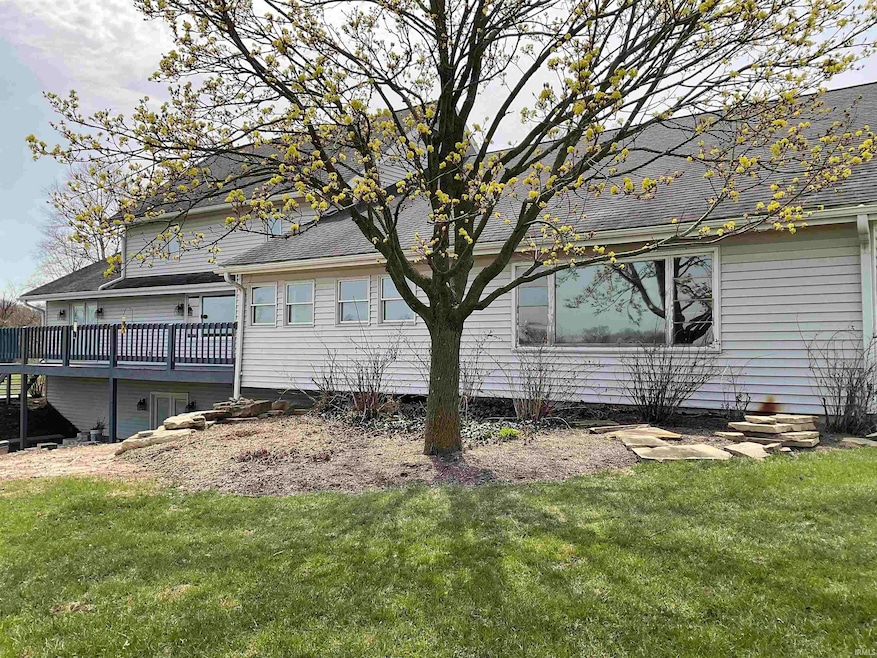
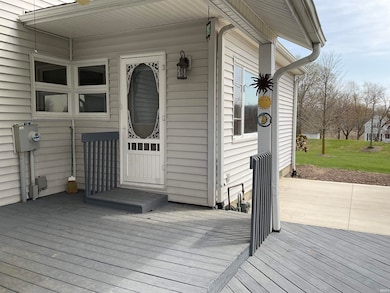

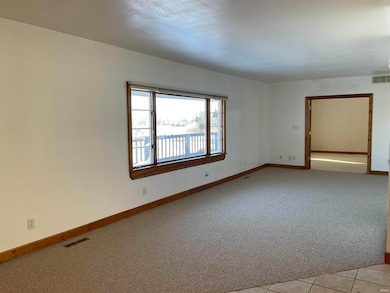
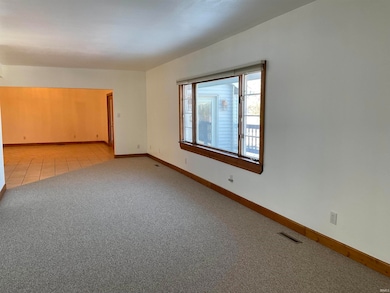
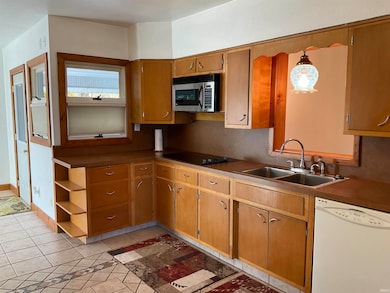
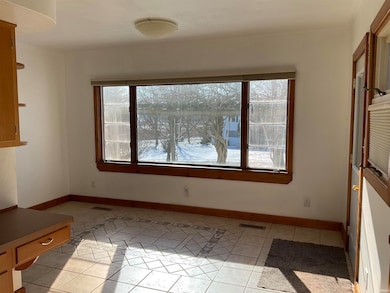
Spacious country home located in SWA School district! Looking for space, comfort and privacy? This 2700 + sq ft sits on a large 3 acre lot and offers everything your family needs. Located in SWA School District, this 4-bedroom, 2 full bathroom, and 2 half bathroom home is perfect for those seeking a peaceful retreat. This home features geothermal heating and cooling, a main floor master bedroom, 3 bedrooms and the second full bath on the second floor and a large finished walk up attic that could be used for a 5th bedroom. In addition to 2700 plus sq ft finished on the upper levels there is also a full finished Walkout basement complete with a second kitchen, pool table and half bath. Outside you'll find multiple decks, a patio and a small storage shed. The attached garage has 1688 sq ft of space with 4 doors, one bay that can be heated and used for warm storage or a workspace. No need to worry about lawn maintenance, mowing is included in the rent. No indoor smoking or vaping. Pet fees - $150 pet deposit plus $20 pet rent per approved pet.
Last Agent to Rent the Property
Perfect Pad Realty, LLC Brokerage Phone: 260-450-3071 Listed on: 04/17/2025
Last Renter's Agent
Perfect Pad Realty, LLC Brokerage Phone: 260-450-3071 Listed on: 04/17/2025
| Date | Event | Price | List to Sale | Price per Sq Ft |
|---|---|---|---|---|
| 05/02/2025 05/02/25 | Rented | $3,000 | +20.0% | -- |
| 04/29/2025 04/29/25 | Under Contract | -- | -- | -- |
| 04/17/2025 04/17/25 | For Rent | $2,500 | -- | -- |
| Year | Tax Paid | Tax Assessment Tax Assessment Total Assessment is a certain percentage of the fair market value that is determined by local assessors to be the total taxable value of land and additions on the property. | Land | Improvement |
|---|---|---|---|---|
| 2025 | $12,731 | $1,196,400 | $164,800 | $1,031,600 |
| 2024 | $12,728 | $1,025,300 | $165,300 | $860,000 |
| 2022 | $10,766 | $920,400 | $76,100 | $844,300 |
| 2021 | $9,753 | $794,300 | $75,500 | $718,800 |
| 2020 | $9,203 | $730,700 | $75,400 | $655,300 |
| 2019 | $9,373 | $734,600 | $74,900 | $659,700 |
| 2018 | $8,051 | $639,900 | $75,100 | $564,800 |
| 2017 | $8,499 | $634,300 | $75,800 | $558,500 |
| 2016 | $8,654 | $627,200 | $76,200 | $551,000 |
| 2014 | $8,163 | $583,700 | $76,500 | $507,200 |
| 2013 | $8,525 | $582,100 | $75,600 | $506,500 |
Landlord's Agent in 2025
Jackie McBride
Perfect Pad Realty, LLC
(260) 450-3071
33 Total Sales
Source: Indiana Regional MLS
MLS Number: 202513303
APN: 02-16-34-102-003.000-048
Disclaimer: Certain information contained herein is derived from information provided by parties other than Homes.com. All information provided is deemed reliable, but is not guaranteed to be accurate and should be independently verified.
![]() Based on information submitted to the MLS GRID. All data is obtained from various sources and may not have been verified by broker or MLS GRID. Supplied Open House Information is subject to change without notice. All information should be independently reviewed and verified for accuracy. Properties may or may not be listed by the office/agent presenting the information. Some IDX listings have been excluded from this website. IDX information is provided exclusively for personal, non-commercial use, and may not be used for any purpose other than to identify prospective properties consumers may be interested in purchasing. Information is deemed reliable but not guaranteed.
Based on information submitted to the MLS GRID. All data is obtained from various sources and may not have been verified by broker or MLS GRID. Supplied Open House Information is subject to change without notice. All information should be independently reviewed and verified for accuracy. Properties may or may not be listed by the office/agent presenting the information. Some IDX listings have been excluded from this website. IDX information is provided exclusively for personal, non-commercial use, and may not be used for any purpose other than to identify prospective properties consumers may be interested in purchasing. Information is deemed reliable but not guaranteed.
Based on information submitted to the MLS GRID
Ask me questions while you tour the home.